Introdução:
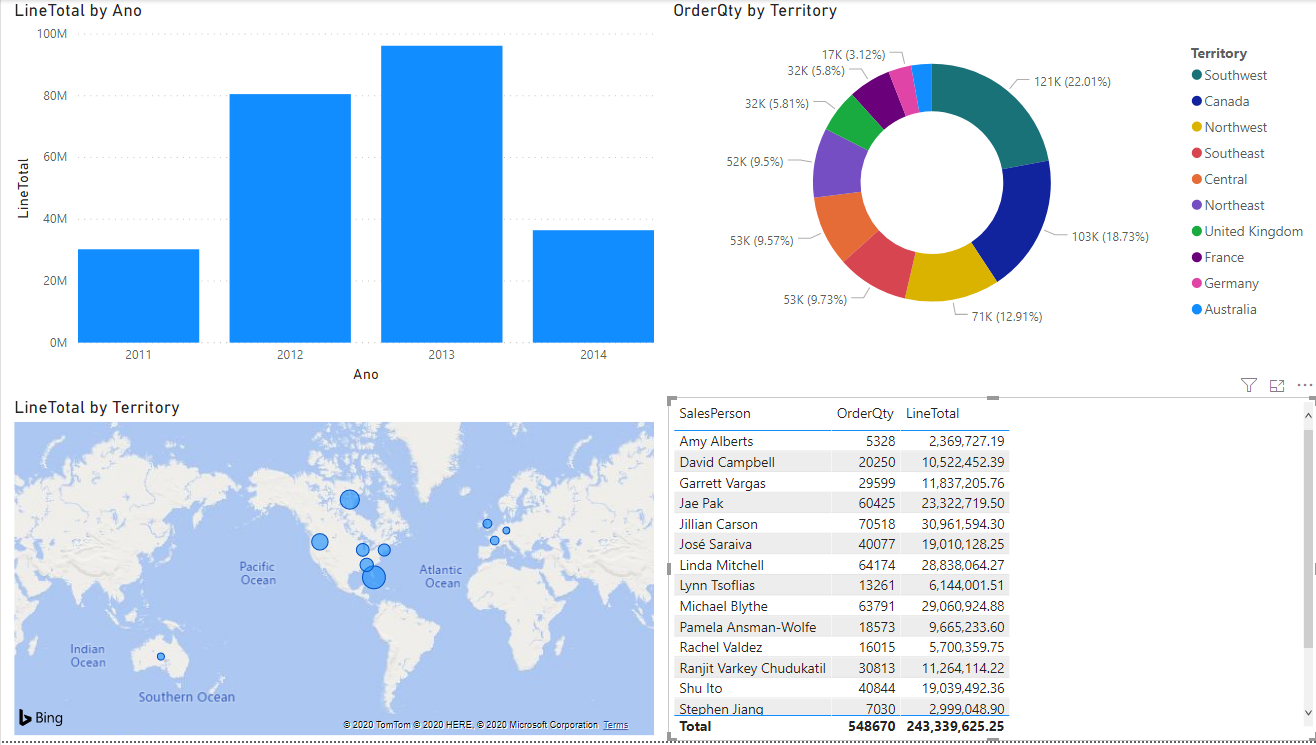
- Importar o "Ficheiro1", escolha o separador "Sales" e recrie o relatório em baixo.
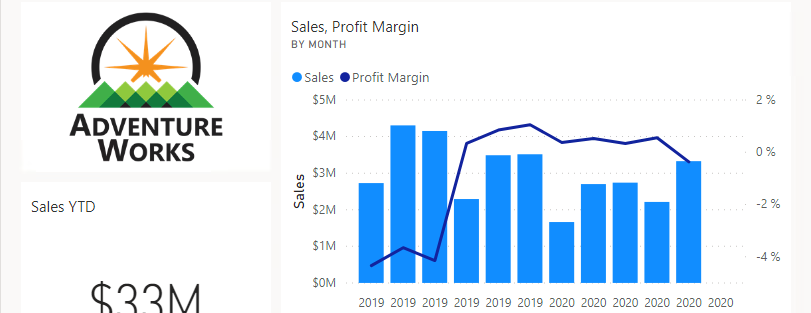
Relatório de exemplo:
Introdução:
- Siga os passos em baixo de forma a transformar os dados de um ficheiro de excel
Passos:
- Descarregar Ficheiro2 para uma pasta no seu computador
- No PowerBI Desktop clicar em obter dados
- Na janela de obter dados clicar em Excel
- Procurar o ficheiro DS_PBI_Training2.xlsx e clicar no botão abrir
- No painel navegador colocar um visto em Sales e clicar em Transformar Dados
- Após a janela do Editor do Power Query abrir clicar na fonte de dados Sales nas consultas
- Nos passos aplicados apagar Tipo Alterado clicando no icon da X atrás do nome
- Nos passos aplicados apagar Cabeçalhos Promovidos clicando no icon da X atrás do nome
- No separador Transformar clicar em transpor
- Verifique que as colunas passaram a linhas e as linhas passaram a colunas
- No canto superior esquerdo da tabela clique no icon Tabela e nas opções listadas clicar em Utilizar Primeira Linha como Cabeçalho
- Clicar com o botão direito em Column1 e escolher Renomear, alterar o nome para País
- Clicar com o botão direito em Column2 e escolher Renomear, alterar o nome para Categoria
- Clicar com o botão direito em Pais, e escolher Preencher e de seguida Baixo, os valores a Null irão ser substituídos
- Seleccionar as colunas dos anos (pressionar Ctrl e clicar nas colunas dos anos)
- Clicar com o botão direito do rato em cima de uma das colunas seleccionadas e escolher a opção anular dinamização das colunas.
- Note que as colunas Atributo e Valor perfazem a paridade Ano-valor
- Clique com o botão direito em cima da coluna Atributo e renomeie para Ano e pressione a tecla Enter
- Clique com o botão direito em cima da coluna Valor e renomeie para Vendas e pressione a tecla Enter
- No separador base clique Fechar e Aplicar
- No painel Campos expanda Sales e clique no campo Pais
- No separador Propriedades em categoria escolher Pais
- Verifique que no painel dos campos no Pais surge um icon com um globo
- No painel Campos expanda Sales e clique no campo Vendas
- No separador Estrutura no tipo de dados clique em Numero decimal
- Na janela que abre clique em Sim (Poder aparecer ou não)
- No separador formato, clicar no $ e escolher o sufixo € para ficar formato como moeda Euro
- Verifique que no painel dos campos no Vendas surge um icon de somatório
- Arrastar o campo Pais para a área branca e verifique que o Power BI automaticamente escolhe o gráfico Mapa
- Arrastar as vendas para o gráfico Mapa e verifique que os tamanhos das bolhas representam as vendas
Instructions:
- Follow the below steps in order to transform the data from an Excel File
Steps:
- In Power BI Desktop, click **Get Data**.
- In the **Get Data** dialog box, click **Excel**, and then click **Connect**.
- In the **Open** dialog box, browse to the DS_PBI_Training2.xlsx, and then click **Open**.
- In the **Navigator** dialog box, select the **Sales** check box, and then click **Edit**.
- In the **Untitled - Power Query Editor** dialog box, in the **Queries** pane, click **Sales**.
- In the **APPLIED STEPS** list, next to **Changed Type**, click the **delete** icon.
- In the **APPLIED STEPS** list, next to **Promoted Headers**, click the **delete** icon.
- On the **Transform** tab, click **Transpose**.
- Note that the columns are now rows.
- In the top left-hand corner of the table, click the **table** icon, and then click **Use First Row as Headers**.
- Right-click the **Column1** column, click **Rename**, type **Country**, and then press Enter.
- Right-click the **Column2** column, click **Rename**, type **Category**, and then press Enter.
- Click the **Country** column, and on the Ribbon, in the **Any Column** group, click **Fill**, and then click **Down**. The null values are replaced.
- Click the **2005** column, hold down the Ctrl key and click the all other year columns.
- Right-click any of the selected column headers, and then click **Unpivot Columns**.
- Note that the names of the columns are **Attribute** and **Value** for the attribute-value pairing.
- Right-click the **Attribute** column, click **Rename**, type **Year**, and then press Enter.
- Right-click the **Value** column, click **Rename**, type **Sales**, and then press Enter.
- On the **File** menu, click **Close & Apply**.
- In the **FIELDS** pane, expand **Sales**, and then click **Country** to select the field.
- On the **Modeling** tab, click **Data Category: Uncategorized**, and then click **Country/Region**.
- In the **FIELDS** pane, note the map icon next to **Country**.
- In the **FIELDS** pane, under **Sales**, click **Sales** to select the field.
- In the **Formatting** group, click **Data type: Decimal Number**, and click **Fixed decimal number**.
- In the **Data type change** dialog box, click **Yes**.
- Click **Format: General**, point to **Currency**, and then click **$ English (United States)**.
- In the **FIELDS** pane, note the sum symbol next to **Sales**.
- Drag the **Country** field onto the report. Note that Power BI automatically chooses the map chart.
- Drag the **Sales** field onto the map, and note that the bubble sizes now represent the Sales figure.
- Click the report canvas.
- In the **VISUALIZATIONS** pane, click **Clustered column chart**.
- Drag **Category** onto the **Axis** property.
- Drag **Year** onto the **Axis** property.
- Drag **Country** onto the **Legend** property.
- Drag **Sales** onto the **Value** property.
- Grab the corner edge of the chart to expand the width and height.
- Click the **Click to turn on Drill Down** arrow icon in the top right-hand corner of the chart.
- Click the tallest column in the **Bikes** group. This now breaks down the sales by year.
Introdução
Importar dados de uma página web
Passos
Analise o link https://pt.wikipedia.org/wiki/Vencedores_do_Festival_Eurovis%C3%A3o_da_Can%C3%A7%C3%A3o
Faça uma importação do link anterior de via web de 1 só tabela que lhe permita recriar o seguinte relatório sobre o segundo classificado (deverá aplicar as transformações necessárias para importar somente a colunas e os registos necessários):
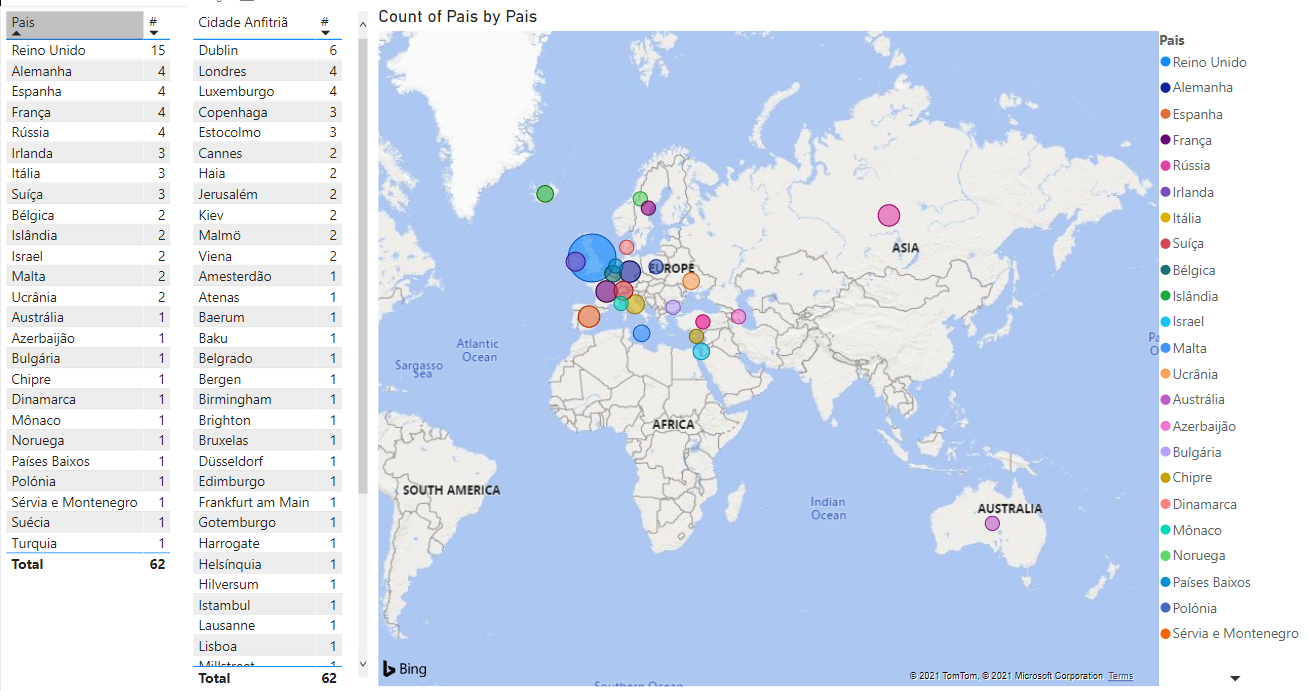
Relatório de exemplo pretendido
Introdução
Criar 3 páginas e navegar entre as mesmas
Passos
- Criar 3 páginas
- Página Inicial
- Relatório 1
- Relatório 2
- Conteúdo Página Inicial
- Botão "Relatório 1"
- Acção - Navegar entre páginas para página Relatório 1
- Botão "Relatório 2"
- Acção - Navegar entre páginas para página Relatório 2
- Botão "Relatório 1"
- Conteúdo Relatório 1
- Texto com Titulo
- Seta para a direita
- Acção - Navegar entre páginas para página Relatório 2
- Botão Voltar ao Menu
- Acção - Navegar entre páginas para página Página Inicial
- Criar 3 gráficos
- Barras
- Circular
- Tabela
- Conteúdo Relatório 2
- Texto com Titulo
- Seta para a Esquerda
- Acção - Navegar entre páginas para página Relatório 1
- Botão Voltar ao Menu
- Acção - Navegar entre páginas para página Página Inicial
- Criar 3 gráficos
- Mapa
- Linha
- Matriz