
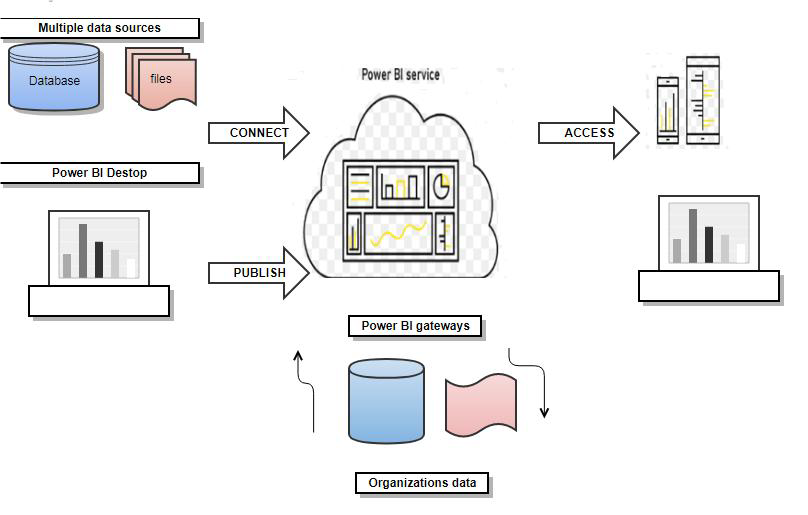
Power BI is a collection of software services, apps, and connectors that work together to turn unrelated sources of data into coherent, visually immersive, and interactive insights. Your data may be an Excel spreadsheet, or a collection of cloud-based and on-premises hybrid data warehouses.
- With Power BI, one can retrieve data from hundreds of data sources, shape the data to fit your specific requirements, perform ad hoc analytics, and present the results through various types of visualizations
- The Power BI service lies at the heart of the Power BI offering, providing a cloud-based platform for connecting to data and building reports. Users can access the service through a web-based portal that provides the tools necessary to retrieve, transform and present business data
- Power BI Desktop is a downloadable application that Microsoft provides for free. The application is essentially a report-building tool that provides capabilities similar to the Power BI service
- With Power BI Desktop, one can build advanced data queries and models, create sophisticated reports and visualizations, and publish the consolidated report packages to the Power BI service or Power BI Report Server.
- Power BI Desktop can be divided into three categories, or views, for how we interact with data and create reports:
Report view: A canvas for building and viewing reports based on the datasets defined in Dataview.
Data view: Defined datasets based on data retrieved from one or more data sources
Relationships view: Identified relationships between the datasets defined in Data view
Power BI dashboards
With updates to Power BI customers can now see all their data through a single pane of glass. Live Power BI dashboards show visualizations and KPIs from data that reside both on-premises and in the cloud, providing a consolidated view across their business regardless of where their data lives.
Simplifying how we interact with data, natural language query is built into the dashboard allowing users to type questions and receive answers from data in the form of interactive visualizations.
One can explore their data further by drilling through the dashboard into the underlying reports, discovering new insights that they can pin back to the dashboard to monitor performance going forward.
Key Components
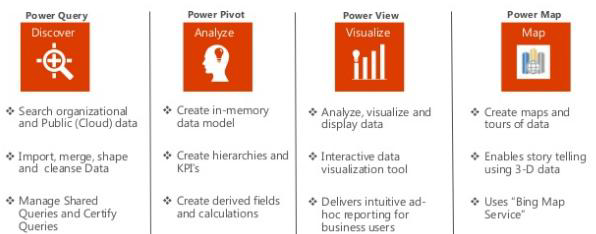
Features
- One of the really unique things about Power BI that separates Power BI from a lot of the other BI tools out there is the really tight integration between Power BI and Excel. Excel and Power BI contain a portfolio of tools that is unique in the industry. Together, they enable business analysts to more easily gather, shape, analyse, and visually explore their data.
In addition to viewing Power BI reports in the web portal, business users can now do the same with Excel workbooks in the new version of Power BI Report Server, giving them a single location to publish and view their self-service Microsoft BI content. - Seamless integration across Office and Azure provides quicker and more cost-effective deployment for any data project.
- Power BI provides a strong backend data manipulation feature with access to simple visualization
- Power BI covers most of the data sources available in Tableau. It is closely integrated with Office 365, hence provides connectivity to SharePoint.
- Power BI online version also supports direct visualization on Search Engine
- Power BI uses cloud storage and includes simple implementation process.
- Microsoft Power BI hosts one of the most user-friendly data visualization tools in the business intelligence market. The drag-and-drop functionality of the software, along with access to over 85 data visualization applications, provides an uncomplicated experience that results in visually appealing and informative reports
- Reports generated in Microsoft Power BI can be exported as PDF, TIFF, HTML and Microsoft Office files. Power BI files include desktop files (pbix) and templates (pbit). With Microsoft as the engine behind Power BI, report exporting and document access is simple.
- Microsoft Power BI possesses the advantage of Microsoft’s familiarity and connections to assorted applications. Users of Microsoft Power BI can mine data from programs such as Microsoft Excel, Google Analytics, MySQL, Oracle, Salesforce, Mail Chimp, Facebook and Zendesk, with new data sources added every month
- The Microsoft foundation of this analytic tool ensures a smooth meshing of Power BI with the existing work base of a business. One of the more innovative features of Microsoft Power BI is the ability to use browser- and desktop-based authoring with apps and platforms that are both on-premise and in the cloud. This hybrid integration strategy is based on the Microsoft Azure Cloud APIs.
- The Microsoft backing of the Power BI platform ensures simple integration with a number of external applications. Nearly every program that works with Microsoft can integrate with Power BI, offering an expansive library of possible collaboration options.
- In conjunction with other Microsoft offerings, including Azure, SQL Server Analysis, real-time data streaming and R-analytics, Power BI provides a broad analytics landscape. Connect Power BI to in-house data sources or external sources like Hadoop, Azure HDInsight and Spark for a full range of data access. Open database connectivity integration provides access to big data sources. Users can visualize, analyze, report and share data pulled from ODBC source
- Power BI presents databases in a menu view where users can simply select their data source of choice, connect to the data and begin the process of analysis and reporting
- Have extensive R and big data-related integrations, ensuring this apps’ scalability for larger projects.
- A highlighting feature is provision of APIs where developers can club Power BI dashboards to other products.
- Microsoft provides integration abilities that are simply unmatched by competitors, resulting in one of the most user-friendly, data-connected business intelligence systems available.
Overall Flow
Best Practices to be followed:
- Keep a Last Refreshed Date’ Exists in the Dataset – The objective is for report consumers to understand the effective date of the data being displayed
- Parameterize data source connections. Parameters can be useful to minimize hard-coding and reduce maintenance during future changes.
- Hide field that is not utilized in the visuals – IDs and surrogate keys are needed for relationships, but are not useful for visuals. Hiding them simplifies the data model because there’s less fields shown in the field list.
- For performance optimization purposes, the most selective condition should typically be nested to limit data as early as possible.
- Keep measures simple initially, and add complexity incrementally. ie Break Measures into Interim Parts
- Description for Query – If a query is doing something unusual, or is serving as an intermediary query, it is very helpful to include a description of the purpose for the query.
- Comments in the M Query can be very helpful to describe the data transformations which are occurring.
- Comments in DAX can be very helpful to describe what’s happening in a calculation. This can be to help others understand the calculation
- Split date and time – Always split it in two columns, one for DATE, and one for TIME. Reduce precision of TIME if necessary down to hour, minute, or seconds, according to business requirements. High cardinality columns are expensive in Power BI, and a datetime column will likely have a unique value for each row. By splitting that information in date and time will save memory, increase performance, and make the data model easier to use.
- Apply Mark as “Date Table” to tables with dates – Time intelligence functions require to mark a table as a Date table if a surrogate key column (typically an integer) is used in the relationship between a fact table and a dimension.
- Create a common theme/look for the report, and apply it to all pages of the report.
- Set the Data Category – Address related columns, such as city/state/zip and so forth, need to be specified in the data model to ensure geocoding can occur properly.
- Create Hierarchies for usability – Date columns (such as Year>Quarter>Month) are a common scenario for use of a hierarchy and should be present in most models. Geography columns (such as Country>State>City) are great candidates as well.
- Be Consistent with font size, font type , font color and page background color.
- Version the report copies with the date as shown below Report Name vYYYYMMDD
- Consider Using the Divide() Function – Instead of Column A / Column B use Divide function. This standard practice prevents invalid numbers being displayed on reports. (nulls or coding around divide-by-zero errors).
- Include only the columns in the dataset that are useful and will be used in the Power BI reports. If a column doesn’t contribute to a visual, calculation, or a relationship, then do not import it to the model.
- Always use table names for column reference even when you define a calculated column within a table
- Provide meaningful and helpful names for the pages/tabs.
- Be consistent with respect to spaces, casing, and abbreviations.
- Create unique field names across the entire dataset – Although the Power BI permits columns to exist which are named the same across tables, that is a poor practice to allow in a data model. The name assigned needs to be self-explanatory on its own rather than relying on the context of its table.