The invisible costs of data pipelines erode budgets and decisions — if you don’t measure, you pay twice.
Why data pipelines blow the budget
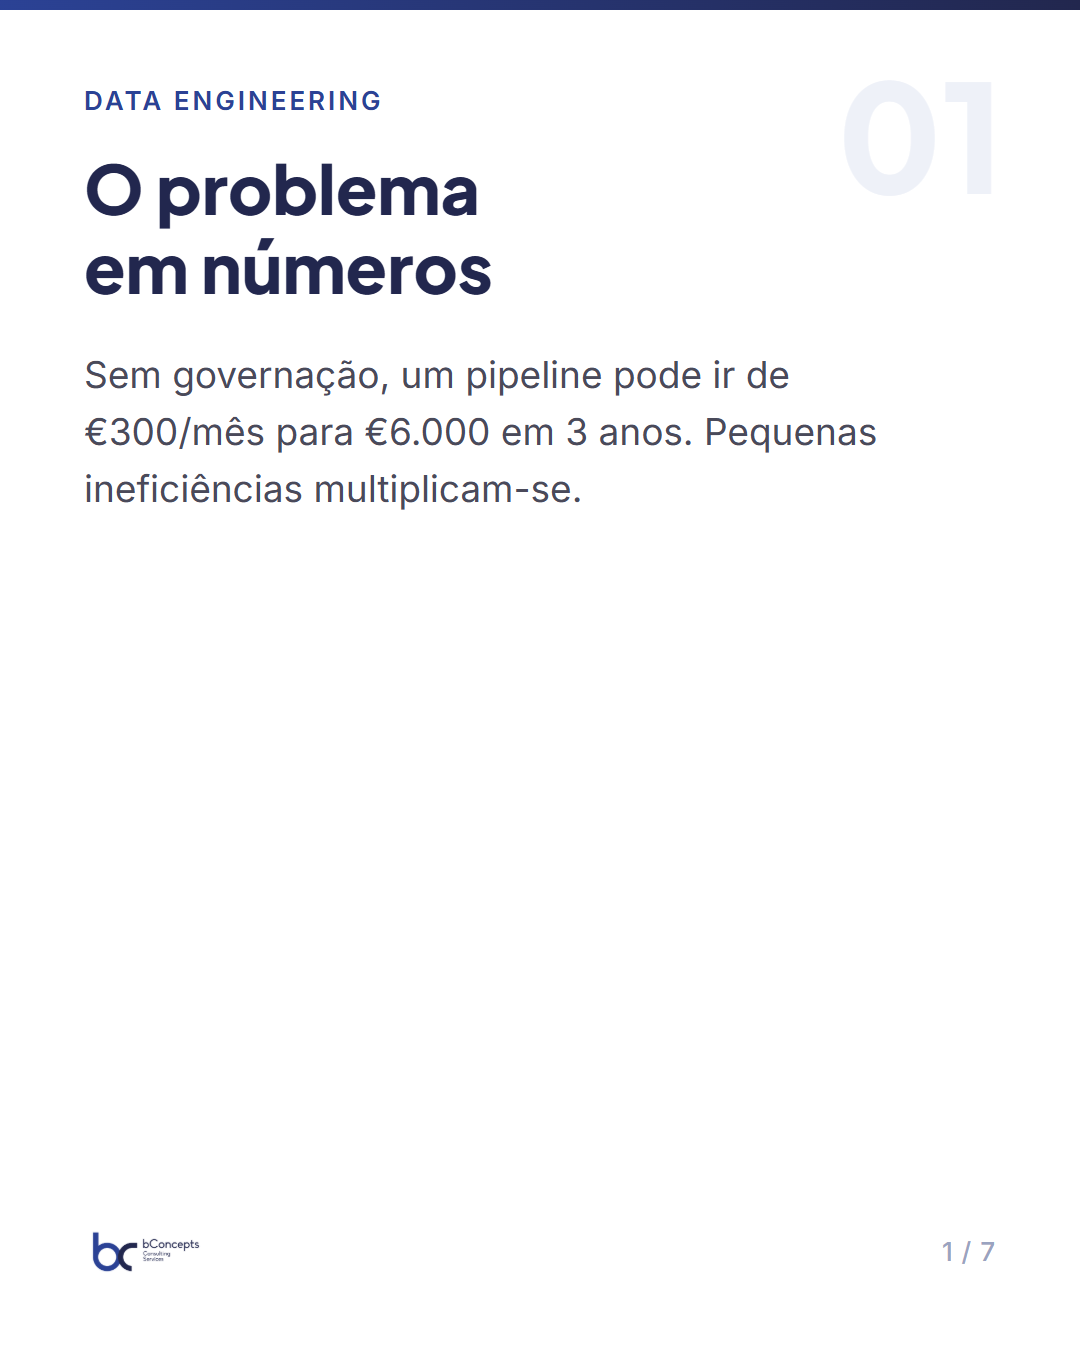
Data pipelines are sometimes treated like utilities: “turn them on, run them and they produce.” That perception hides several sources of expense that grow nonlinearly and cumulatively. For example, an average operator might initially pay €300/month for ingestion and processing; three years later, without governance, that amount can scale to €6,000/month due to overlapping copies, lack of cleanup and multiplicity of jobs. It’s easy to underestimate the compounding effect: small inefficiencies across hundreds of jobs produce large waste.

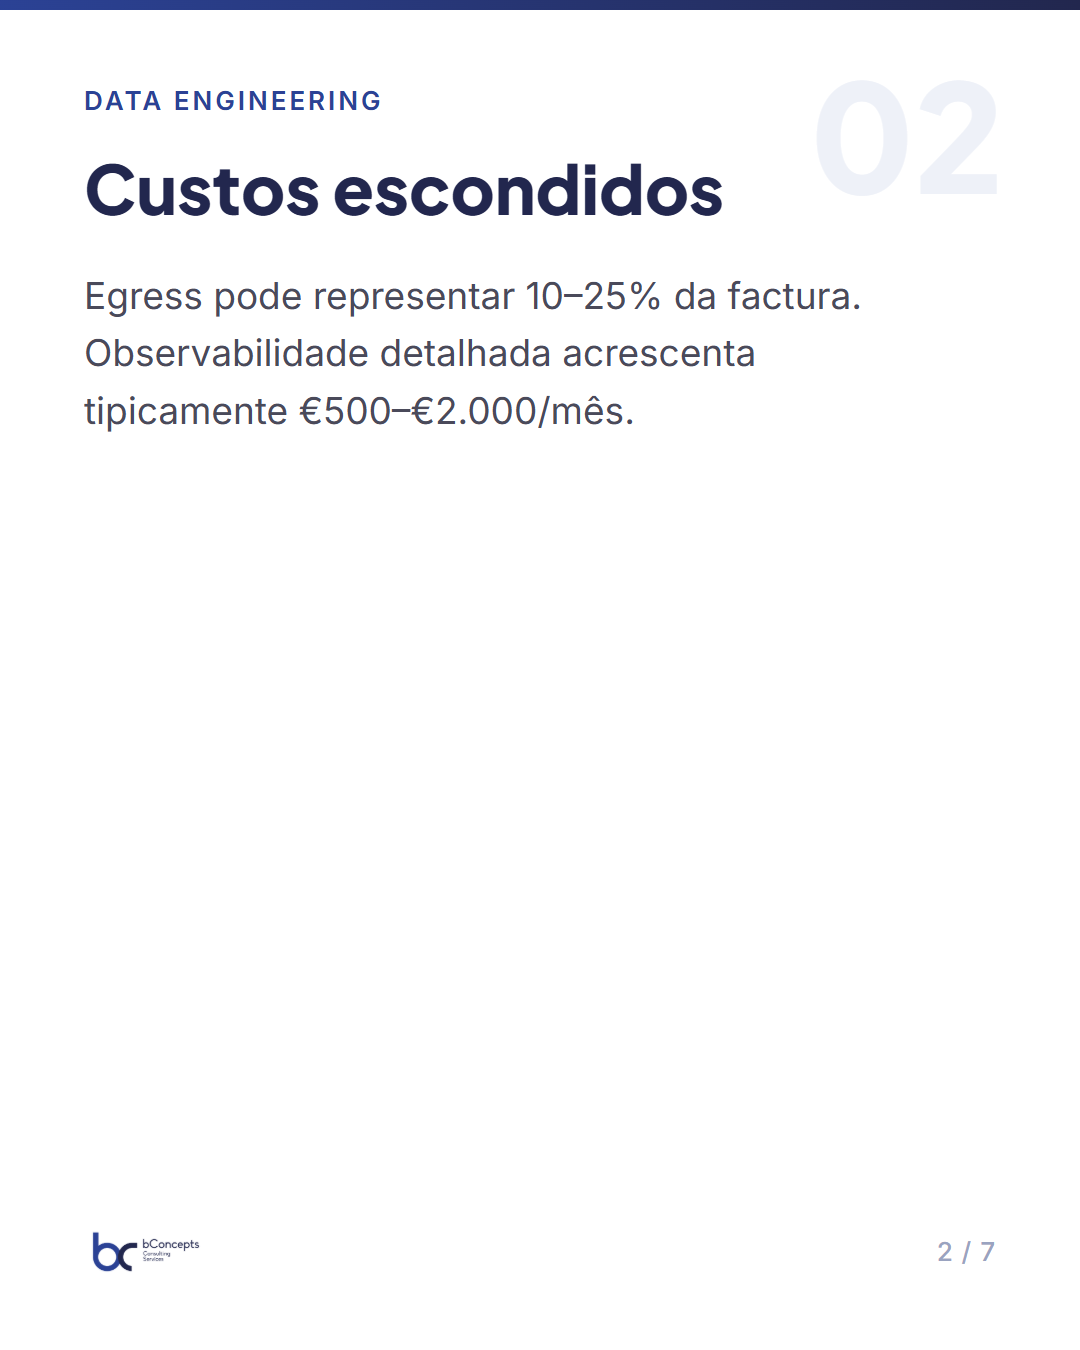
Beyond the obvious components — storage and compute execution — there are less visible costs that add up and are frequently forgotten in the initial design. Egress traffic can represent 10–25% of the bill for companies with cross‑region integrations or external vendors. Operational latency translates into hours of SRE and engineering responding to failures or re‑running pipelines, which financially is paid time for people with high costs (for example, one senior FTE can cost €8k–€12k/month). Recurrent testing and validation, high‑detail logs, metrics and traces also generate direct costs: a large observability system can add €500–€2,000/month depending on retention and granularity.
When you add everything up, it’s not uncommon to see 20–40% of the IT budget indirectly attributed to pipelines and data platforms, with peaks in data‑driven organizations. Decision‑makers need to see these numbers because they make the policy, retention and prioritization decisions. An apparently technical decision — keeping 90 days of detailed logs — can amount to hundreds of thousands of euros per year for an organization with tens of TB.
Which metrics should interest decision‑makers
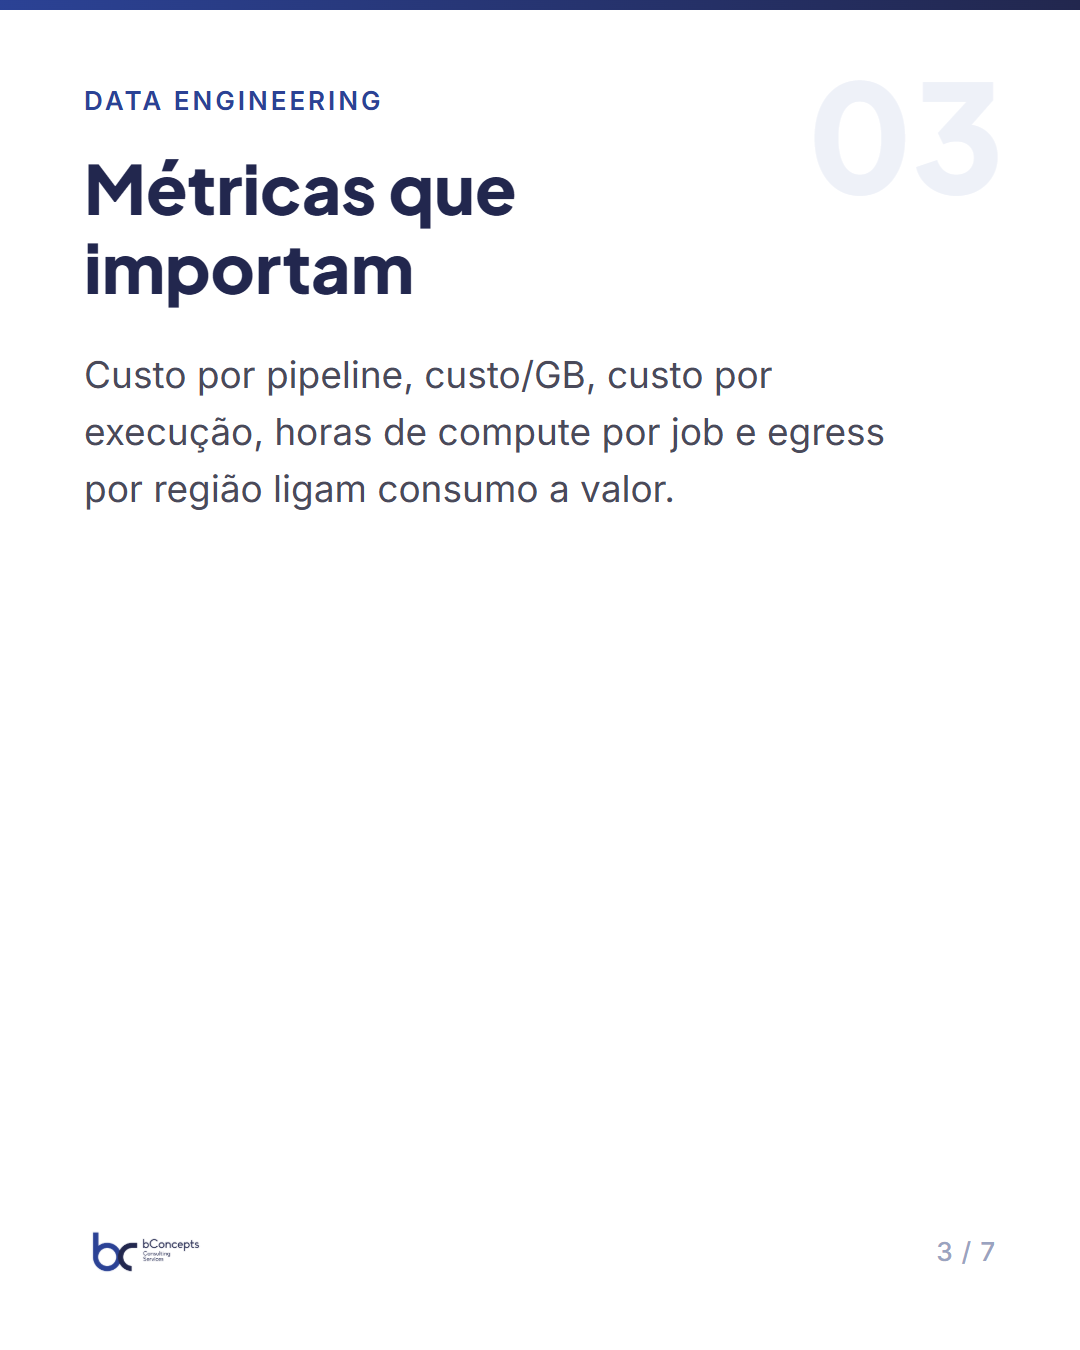
Measuring is the first step to controlling. Some metrics that should appear on an executive dashboard are essential and allow linking consumption to value:
- Monthly cost per pipeline (€/month): gives direct visibility of the financial impact of each flow.
- Cost per GB processed (€/GB): helps compare efficiencies across pipelines and formats.
- Cost per run/job (€/run): relevant for scheduled pipelines or frequent triggers.
- Average compute hours per job (h/job): shows whether jobs are under‑ or over‑provisioned.
- Percentage of cost related to hot vs cold storage (%): indicates if tiering is optimized.
- Egress by region (€/month): helps decide replication and cluster placement.
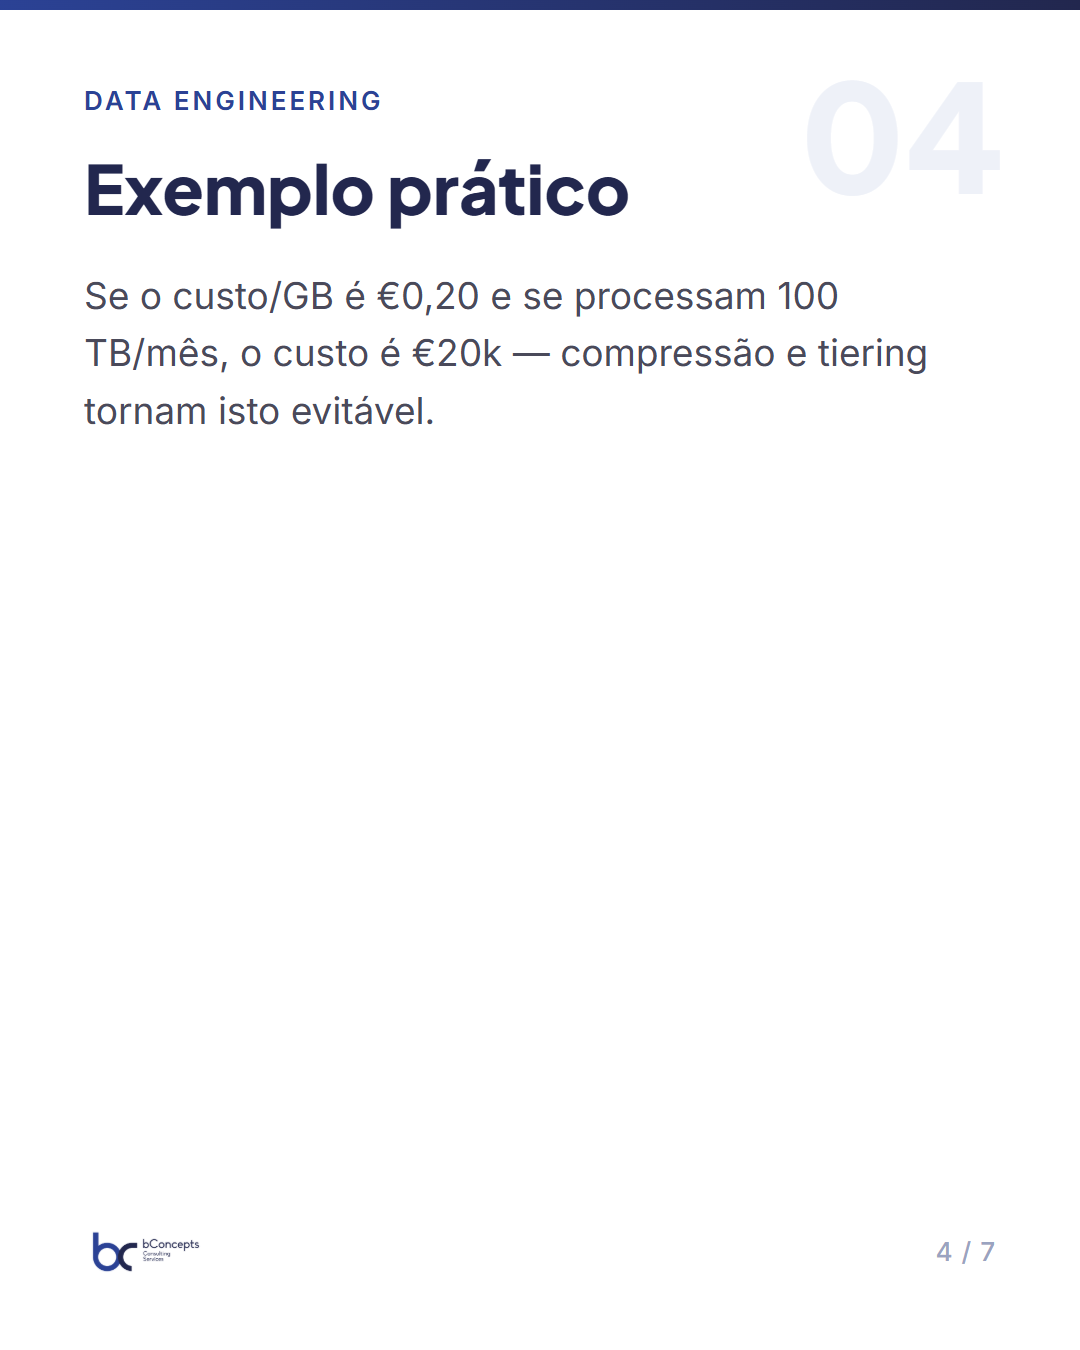
These metrics answer practical questions: are we paying for data that nobody uses? How much does each model training run cost? A practical example: if a pipeline shows a cost per GB of €0.20 and processes 100 TB/month, that equals €20k — an amount that justifies interventions like compression and tiering. If, concurrently, operational metrics indicate that 35% of data read is never queried for business use, the case for action becomes even stronger.
Complementing financial metrics with operational indicators facilitates daily decisions. Average ingestion latency, retry rate per job, percentage of data read but never used, and number of copies of a critical table allow prioritizing actions. For example, a decision‑maker who sees “cost per GB: €0.12” and “data read but not used: 35%” has a clear entry point: applying retention, tiering and compaction could cut substantial costs without degrading value.
Architectural practices that reduce costs without sacrificing value
There is no single correct architecture, but there are principles that consistently work. First, apply data tiering: separate hot (daily access), warm (weekly access) and cold (monthly or less). Practically, defining access SLAs helps automate movement: for example, hot data with 7‑day retention in the most performant layer, warm for 30–90 days in less expensive storage, and cold for over 90 days in object storage with a much lower cost per GB (typical difference: hot €0.10–€0.15/GB/month vs cold €0.005–€0.02/GB/month).
Second, adopt compact columnar formats (Parquet/ORC) with appropriate compression to reduce storage and read costs — in many scenarios compression reduces 60–80% of physical volume, and reading specific columns reduces the I/O that is effectively charged. If a 10 TB dataset is stored in Parquet with compression and occupies 3 TB, and if read cost is based on GB read, the monthly savings can be hundreds to thousands of euros depending on access patterns.
Third, choose the appropriate compute model. Spot/preemptible instances for batch loads not sensitive to interruption can cut 50–80% of compute cost. For predictable, long‑running workloads, reserving capacity (RI) or using S3‑backed instances with autoscaling can be more economical than serverless. Serverless is great for peaks and reducing management overhead — for example, a function costing €0.0002 per second can be cheap in bursts, but for continuous workloads of several hours per day it can be more expensive than an optimized VM. A hybrid approach (serverless for orchestration; optimized clusters for transformation) is often the most efficient.
Finally, avoid duplication. Having a single source of truth layer and using references (views or lazy materialization) instead of multiple copies reduces storage and operational complexity. In organizations where each team makes its own copy for ETL, it’s common to see 2–4 copies of the same dataset; consolidating to 1–2 copies reduces storage cost and simplifies governance.
Policies and governance to maintain cost discipline
Those who define policies gain control. Implementing standard retention rules by data type (e.g., debug logs 30 days, transactional events 365 days, production snapshots 7 days) and quotas per team prevents uncontrolled growth. Automatic expiration policies applied by tags remove the manual burden and prevent forgetfulness: a simple lifecycle rule can move files to cold storage after 30 days and delete after 365 days.
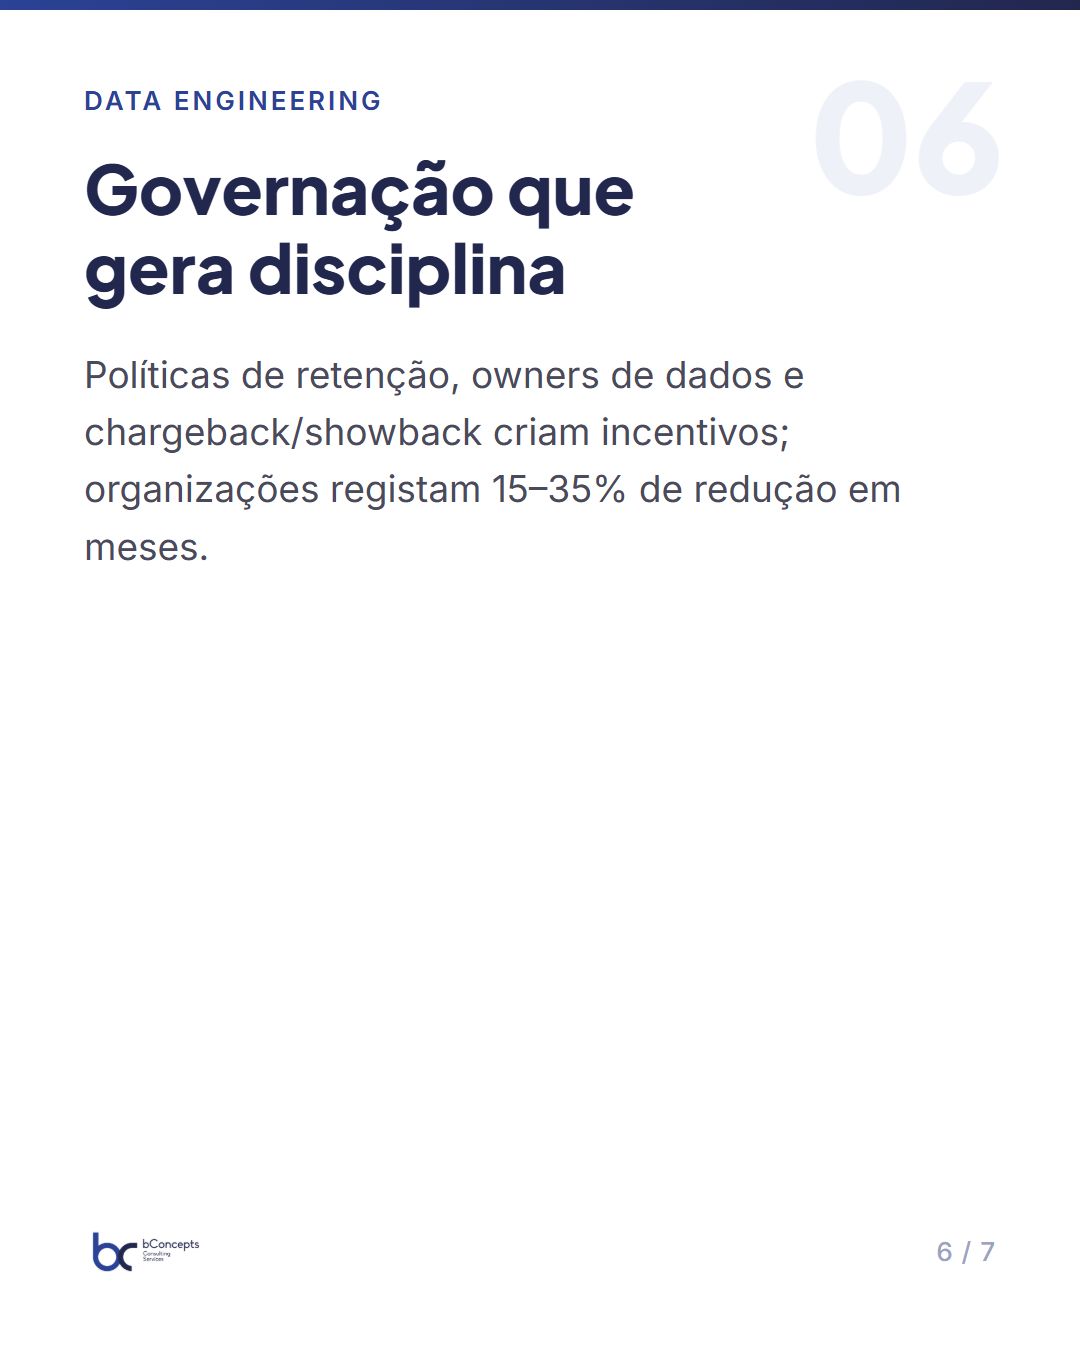
Assigning data owners responsible for cost and utility creates incentives for cleanup and optimization. In an effective governance model, each dataset has an owner and a business sponsor; owners are accountable for dashboards showing cost, usage and SLA. Quarterly review of those dashboards turns governance into an operational routine rather than an occasional audit.
Financial chargeback or showback — where each team sees the bill for its pipelines — is not just accounting; it signals value. A simple model: allocate storage and compute costs by tag and report monthly with comparisons. For example, a team that sees a 30% increase in pipeline cost (from €1,000 to €1,300/month) will be motivated to act: reduce retention, rewrite jobs, or consolidate datasets. In organizations that implemented chargeback, it’s common to observe 15–35% consumption reduction in 3–6 months without loss of analytical capability.
Tools and automation: where to invest to improve cost/value ratio
Automation reduces errors and operational costs. Cost alerts (by pipeline, by tag), automatic lifecycle policies (move data to cold storage after X days), and workflows that detect inefficient jobs (e.g., unnecessary full table scans) cut waste. Data observability tools that correlate cost with usage (who accesses, which queries, frequency) bring actionable insights: if a table costs €3k/month and is queried by only 3 queries per week, the decision is clear.
Investing in tests and CI for pipelines pays dividends. Pipelines with validation and regression prevent repeated executions due to errors, reducing unnecessary consumption. A poorly tested pipeline that fails 10 times a month and re‑executes consumes compute hours that could amount to €500–€2,000/month depending on the profile. Integrating unit tests, data tests and smoke tests avoids these costs.
Other high‑return investments include: tagging and billing export tools (to map costs by project/team), automated compaction and rewriter scripts (e.g., compact small files into larger ones to reduce overhead), and intelligent autoscale mechanisms that shut down resources outside business hours. Together, these automations bring predictability and reduce the manual effort of management.
Mini practical case: reduce 40% of costs at a logistics operator
At a logistics company with 80 people, the data team spent €24,000/month in cloud for pipelines and platforms (including ingestion, processing, storage and daily inferences). The initial breakdown revealed a typical picture: storage €8,000/month, compute €12,000/month, egress €1,200/month, observability €1,000/month, and misc. (backups, snapshots) €900/month. Management requested a reduction plan with payback under 9 months.
The analysis identified four clear targets: 1) 40 TB of logs with indefinite retention and low use; 2) ETL jobs scheduled every 15 minutes when hourly runs were sufficient for business requirements; 3) three copies of the same table across environments (dev, staging, prod); 4) on‑demand instances for batch workloads. The plan was practical and prioritized low‑risk actions.
Interventions applied in 3 months:
- Reduced debug retention to 30 days and migrated the 25 TB least accessed to cold storage: direct storage savings from €4,200 to €800/month.
- Recompaction of datasets into Parquet with compression (average 40% reduction in read volume and 50% reduction in read cost for typical queries), resulting in an estimated €1,800/month saving in read and I/O.
- Consolidation of tables and elimination of redundant copies, freeing 6 TB and saving €1,500/month in storage and maintenance.
- Rescheduling jobs from 15m to 60m where acceptable, reducing runs and compute consumption by 35% (saving €3,600/month).
- Adoption of spot instances for batch loads tolerant to pre‑emption, cutting 60% of those workloads’ cost (additional €1,800/month saving).
Result: monthly cost fell from €24,000 to €14,400 — a 40% reduction — with initial engineering effort of about 1.2 FTE over 3 months (estimated cost ~€15k). Payback: about 5 months. Beyond direct cost reduction, predictability and transparency improved: cost dashboards by tag and alerts allowed detecting variations before they became economic issues, and the team gained repeatable practices to avoid regression in consumption.
Controlling pipeline costs is not about cutting capabilities: it’s aligning expense with value, operational discipline and architectural decisions.
In summary
- Measuring costs per pipeline and by usage (€/GB, compute hours) is essential for informed decisions.
- Architecture, formats (Parquet/ORC), tiering and use of spot instances generate substantial savings without loss of value.
- Retention policies and cost allocation (chargeback/showback) create incentives for continuous optimization.
- Automation for lifecycle, cost alerts and testing reduces operational waste and increases predictability.
- Engineering interventions have quick payback; a 3–6 month plan often reduces costs by 30–50%.
Controlling pipeline costs is a combination of clear metrics, pragmatic architecture, policies and empowering teams to make informed decisions. For decision‑makers, this means prioritizing initial investment in reviews and automation rather than accepting rising costs as inevitable.
Practical next steps: audit the current map of pipelines and obtain a cost breakdown by tag, build a cost dashboard by tag and by pipeline, apply retention policies and identify 2–3 quick wins (compression, eliminate duplicates, move inactive data). Which part of your data ecosystem do you want to audit first to identify the biggest waste?