Introducing a change in a data pipeline without testing it in production is inviting a failure at the first opportunity. Canary deployments are the controlled way to learn quickly without compromising production. They are a technique that combines disciplined engineering with objective decision criteria, allowing complex changes in transformations, joins and aggregations to be evaluated with limited exposure and guaranteed recoverability.
Why use canary deployments in data pipelines?
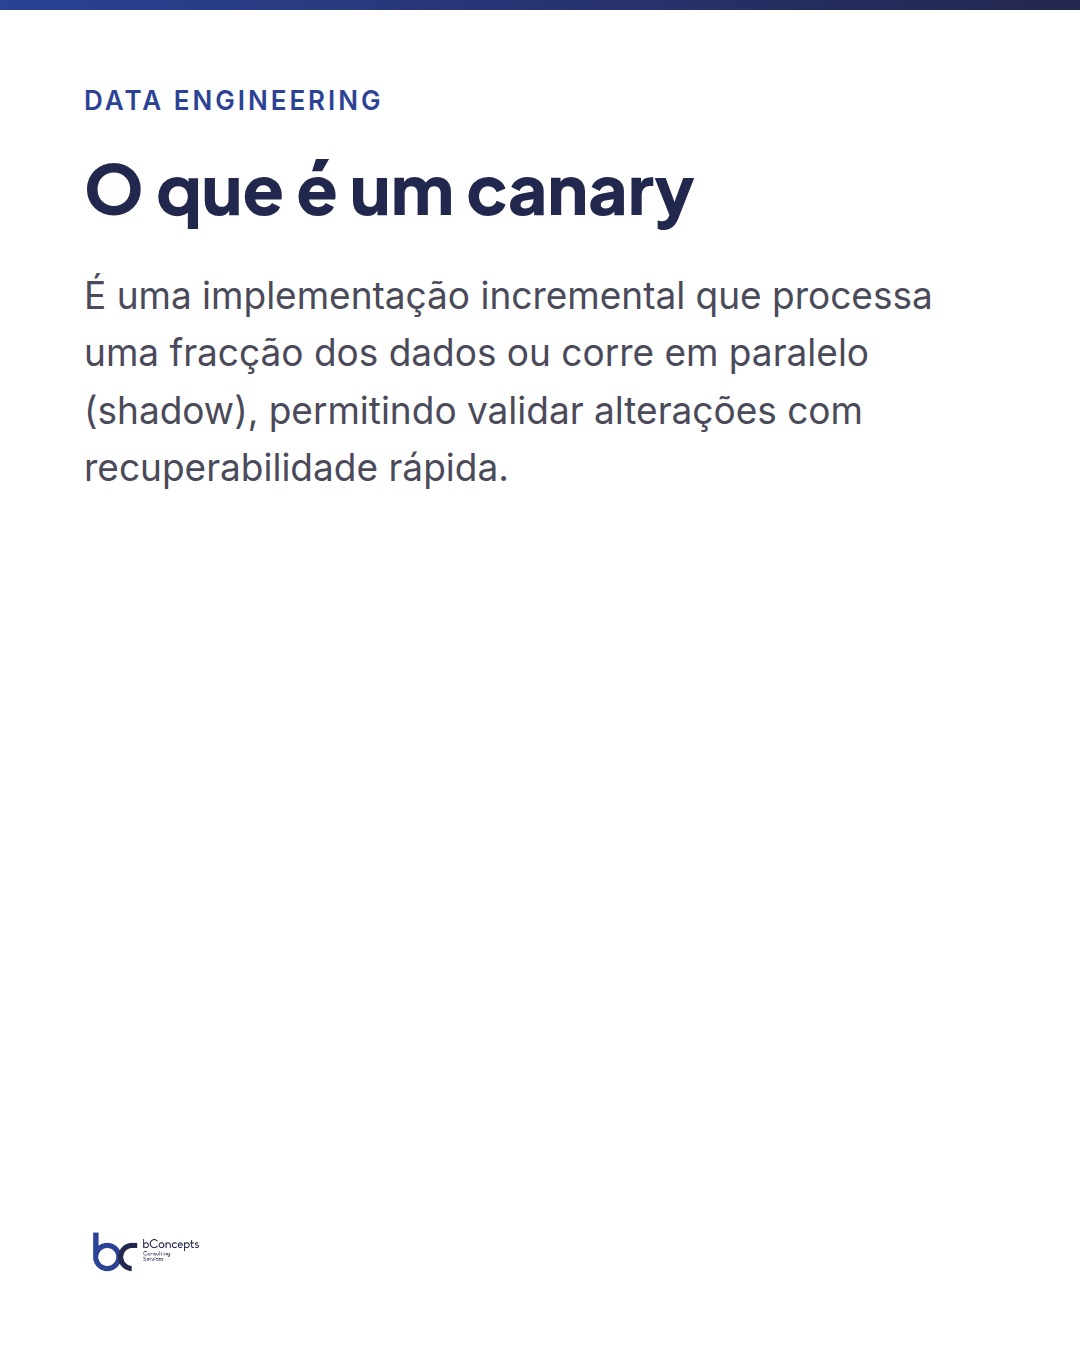
Most data teams still apply a binary flow: develop, test locally or in a development environment, promote to production and trust that nothing breaks. That model works for small, well-understood changes, but fails when transformations interact with real data, quality issues, or unexpected loads. A canary deployment rolls out a change incrementally, over a fraction of the traffic or data, allowing measurement of real impact with limited exposure and, more importantly, a fast rollback path.

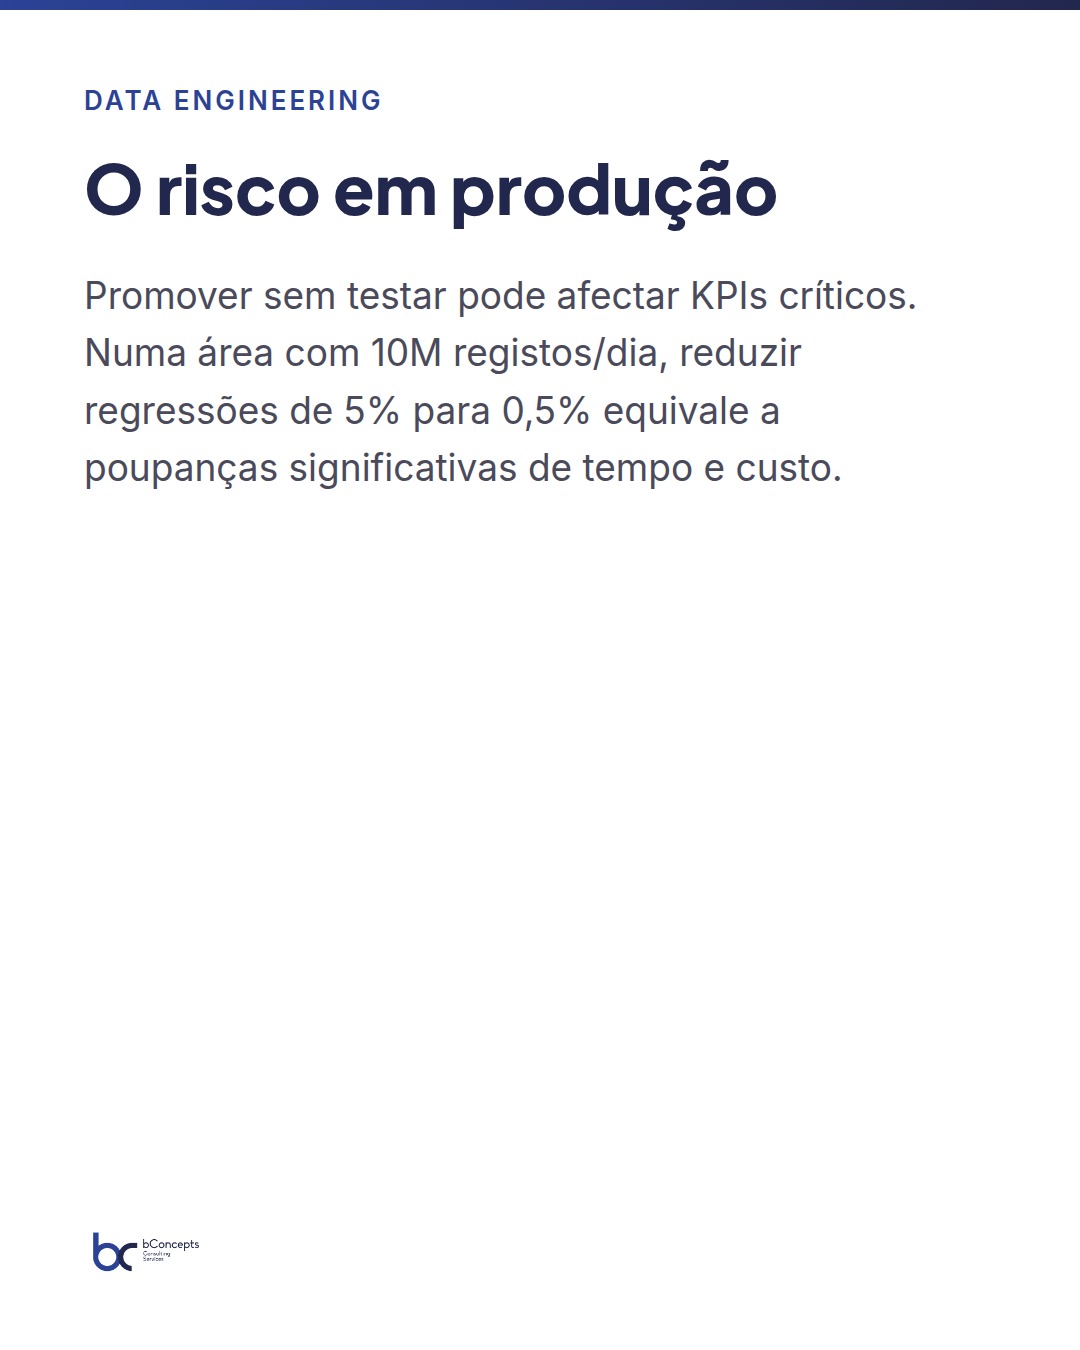
In the context of data pipelines — where a poorly constructed JOIN or a change in aggregation order can alter critical indicators — the ability to validate changes in production with low risk changes how we operate. Instead of long cycles of manual testing and overnight maintenance windows, we gain rapid iterations, visibility of the effect on real KPIs, and explicit rollback mechanisms. This translates into fewer major incidents, shorter delivery cycles and greater confidence to promote changes frequently. Practically speaking, reducing the rate of critical regressions from 5% to less than 0.5% in a business area processing 10 million records per day can save tens of engineering hours and hundreds of thousands of euros per year.
Canary models: percentage, sample and shadow
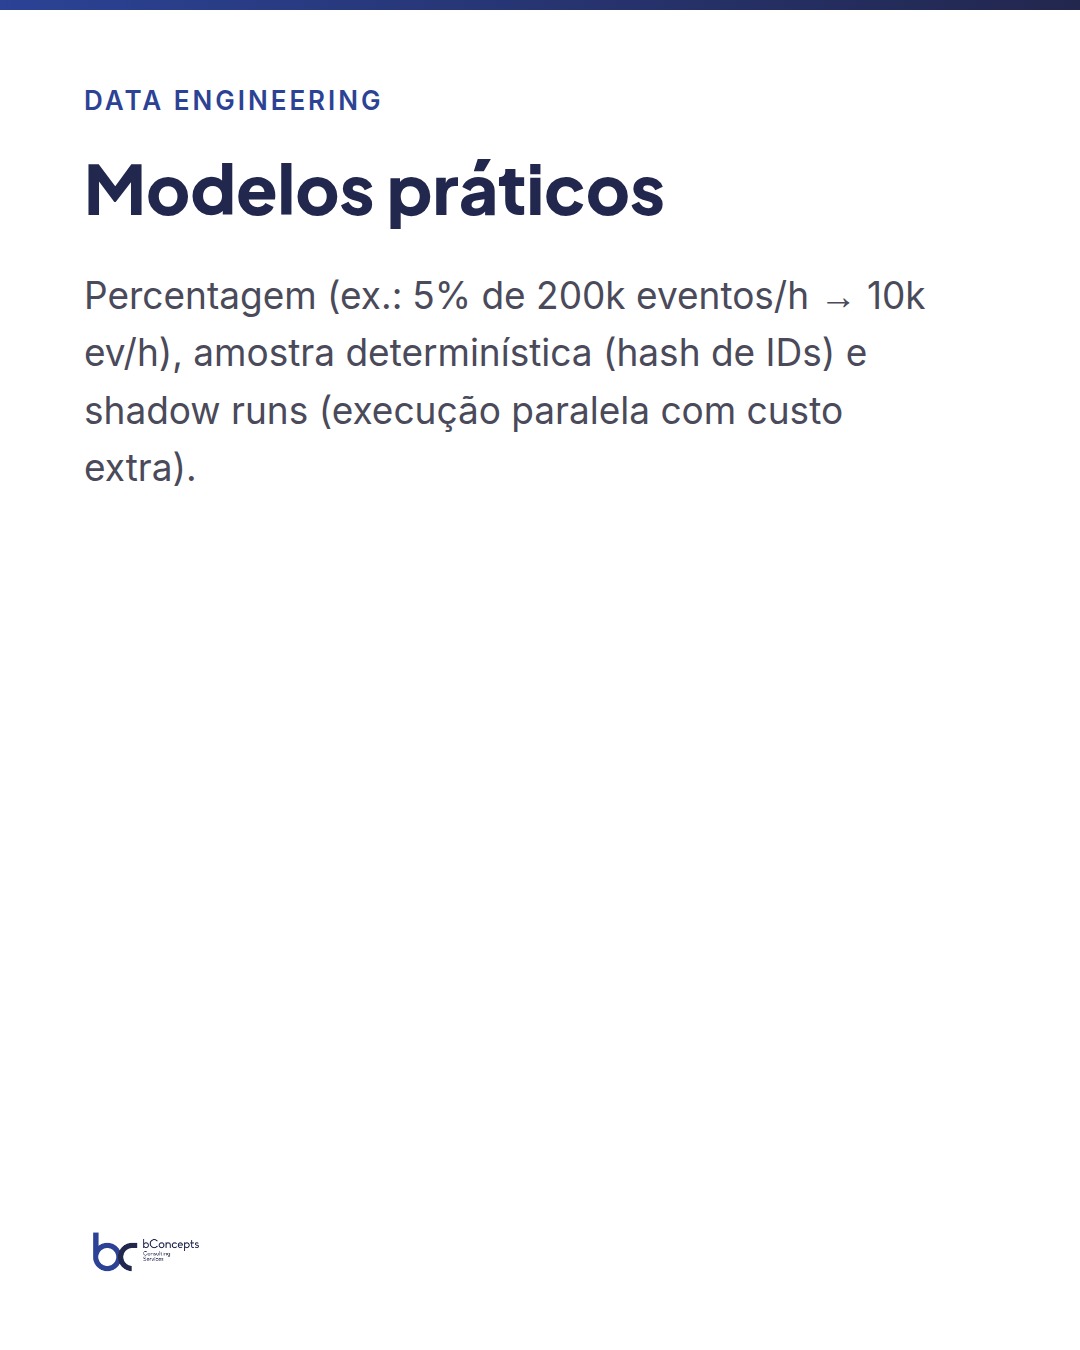
There are three practical models we use at bConcepts in projects with Microsoft Fabric. The first is the percentage canary: the new version processes, for example, 5% of the events or partitions. This model is simple to parameterize for continuous flows and is useful when the load is homogeneous. For example, in a stream with 200,000 events per hour, a 5% canary will process 10,000 events/hour, enough to detect latency variations and obvious regressions.
The second is the deterministic sample canary: we choose subsets based on a reproducible rule, such as customer IDs whose hash ends in 0–4. The advantage is reproducibility between runs and the ease of audit. If we need to repeat a canary to validate a fix, we know exactly which records we repeat. To give numbers: in a database with 5 million customers and 1.2 million monthly orders, a 5% sample corresponds to 60,000 customers or about 60,000 monthly orders, which is a statistically significant sample to detect deviations in average values.
The third is the shadow run: the new transformation runs in parallel with the old one, without affecting consumers, and the results are compared. This is the safest to validate without impacting users, but implies additional processing and storage cost. In terms of trade-offs, a shadow run that duplicates processing for 48 hours can increase compute cost by 100% for that period, but reduces almost to zero the risk of delivering corrupted data to consumers.
The choice between percentage, sample and shadow depends on cost, KPI criticality and observability capability. For logic changes in financial calculations, we prefer shadow runs followed by deterministic samples before increasing percentages. For low-criticality changes, a percentage canary may be sufficient.
How to implement a canary in Microsoft Fabric: concrete steps
Implementing a canary in Fabric starts by treating transformations as versioned artifacts. Use the Git integrated into the Workspace to version notebooks, Spark SQL scripts, pipelines and Dataflow definitions. Each canary should have a dedicated tag or branch and a set of parameters to control the percentage or sampling rule.
Practical step-by-step flow: 1) create the canary version of the transformation, e.g. /transforms/orders/v2-canary; 2) parameterize the ingestion/transformation pipeline with a canary_selector argument, e.g. hash(customer_id) mod 100 < 5; 3) deploy the pipeline to the staging environment and prepare a canary route in production; 4) activate the canary execution via a controlled trigger (scheduled or on-demand). In Fabric, orchestration can use Pipelines, the component equivalent to Azure Data Factory, to trigger Spark jobs or Dataflow with parameters. It is essential that target tables support parallel writes without corrupting data — here Lakehouses with ACID commits, like Delta Lake in Fabric, are an ally because they guarantee atomicity and isolation during concurrent writes.
Important operational details: ensure operations are idempotent (a re-run does not duplicate data), that natural keys exist for merges, and that partitions are chosen to avoid hotspots. For example, in a table partitioned by day, configure the canary to write to temporary partitions like dt=2026-09-24_canary and only after validation promote to dt=2026-09-24. This allows validation without blocking reads and facilitates rollbacks by simply deleting temporary partitions.
Regression detection: tests and metrics to automate
A canary is only useful if we have objective criteria to accept or reject the change. Automate tests that cover integrity, volume and semantics: counts per partition, checksums per key-column, percentage of null values, cardinality of keys and detection of deviations in the distribution of critical metrics, such as average order value or average handling time.
A decision panel with metrics and thresholds is recommended. For example, if the difference in total count between the old version and the canary is greater than 1% or if the number of new unmatched keys exceeds 0.5%, then trigger a critical alert. For distributions, simple techniques like the Kolmogorov–Smirnov test on samples can signal structural changes; alternatively, use percentiles (P50, P90, P99) to detect asynchronous shifts. These comparisons are automatable with notebooks that run after each canary and store results in meta-observability tables for later audit.
Also include transformation latency metrics (execution time per job), number of regressions per customer and parsing exception rate. Define a formal decision plan: for example, if three critical metrics violate thresholds at the same time, the system should block automatic promotion and send an alert to the on-call team.
Backout and rollback: safe strategies
Plan the rollback before the first canary. There are two strategies we frequently use: view swap and dual writes with a toggle. In the view swap, consumers read through a view that points to the stable table; when the canary is accepted, we update the view to point to the new table. A view change is atomic and immediate, reducing downtime to seconds and avoiding direct overwriting or removal of old data.
Dual writes involve writing the results of the old version and the canary into separate tables during the test period. If we detect a regression, we continue to serve the old table. If we accept the canary, we perform a consolidation (merge) operation and update pointers. For example, during a 48-hour canary at 5% of traffic, writing two copies of 60,000 records means doubling storage for a few hours, a cost generally below €2,000 for moderate workloads, but which pays off compared to the cost of a production incident.
In the case of merges, prefer key-based operations with transactional confirmation from the Lakehouse to avoid deadlocks. Have tested rollback scripts and a clear playbook: steps, responsible parties and maximum execution times. Periodic rollback rehearsals reduce mean recovery time and increase team confidence.
Monitoring and observability: what to measure in real time
Monitoring a canary requires infrastructure and business metrics. For infrastructure, track execution latency, cluster CPU/memory consumption, I/O utilization and job failure rate. For business, focus on row counts, variation of key KPIs and percentage of requests with parsing/transformation exceptions. A combined view allows distinguishing between a latency spike caused by a traffic surge and an error in transformation logic.
Implement alerts with tiered thresholds: warnings with low thresholds, for example 0.5% variation, and criticals with stricter thresholds, for example 2% or more. Response time is essential — configure pipelines to send an automatic summary after each canary run with a small health-check JSON to an observability topic like Event Hub or directly to Azure Monitor. Dashboards in Power BI connected to the meta-observability tables turn this data into actionable decisions shareable with non-technical stakeholders.
Include timestamps in observability events and store comparison test results in tables with a timestamp and canary ID. This allows analysis of historical regressions, calculation of canary success rate and tuning thresholds based on empirical evidence.
Mini case study: medium-sized online retail
In an online retail company with 250 employees and 1.2 million monthly orders, the data team needed to update the logic for calculating net order value. The change involved a new rounding routine and discount adjustment that could affect the daily financial reporting SLA and impact reported profits.
We opted for a deterministic sample canary: 5% of customers (hash modulo 100 < 5). The canary ran for 48 hours as a shadow run, while the old pipeline continued to serve reports. Automated metrics included: total order count (maximum acceptable difference 0.3%), total sum of net value per day (threshold 0.5%) and number of rows with discrepancies per customer (threshold 0.1%). We also monitored average execution latency per job; any increase above 25% triggered an infrastructure alert.
Practical results: the canary processed 60,000 orders (5% of traffic), detected an average net value difference of 0.7% in a subcategory of 8,000 orders due to an edge case of stackable coupons that hadn’t been considered by the new logic. The critical alert allowed stopping the promotion of the canary before reaching 20% of traffic. The team fixed the logic in 6 hours, reran the canary for another 24 hours and validated that differences fell below 0.2%.
Costs and benefits: the incremental compute cost over the two days was about €1,200 (Spark cluster configured with 8 vCPU and 64 GB RAM for duplicated runs), while the potential financial impact avoided was estimated at €120,000 per month if the regression had been promoted and affected billing reports. These numbers demonstrate the direct ROI of a well-planned canary.
A well-designed canary turns a risky change into a controlled experiment: it tests in production, but with seat belts on.
Operationalization: checklist before launching a canary
Before activating a canary, validate these items: 1) artifacts versioned and tagged in Git; 2) selection parameters tested in staging with representative data; 3) target tables with safe writes and ACID commit support; 4) pipelines with detailed logs and tracing enabled; 5) automated integrity and business tests implemented; 6) rollback plan approved, documented and rehearsed; 7) alerts and dashboards configured and tested; 8) communication agreements with data consumers and dependent teams.
One often neglected step is communication: inform data consumers, BI teams, analysts and applications about the canary window, what to measure and how to report manual anomalies that automated tests might not detect. Establish a feedback channel (for example, Teams or Slack with a bot that collects incidents) and an on-call contact during the canary window. Coordination reduces false positives and speeds decisions.
In summary
- Canary deployments reduce risk by validating changes in production with limited exposure and clear rollback plans.
- Choose the appropriate model — percentage, sample or shadow — according to criticality, cost and observability capability.
- Automate comparisons: counts, checksums, distributions and percentiles; define clear thresholds and a decision playbook.
- Plan rollback with view swaps or dual writes; minimize downtime and preserve auditability with temporary partitions and ACID commits.
- Monitor infrastructure and business metrics; make canary results consumable via dashboards and alerts for rapid decision making.
Implementing canary deployments in pipelines on Microsoft Fabric is an engineering investment that pays dividends in reliability and delivery speed. For teams that want to move faster, the canary is the bridge between controlled experimentation and safe production.
Next practical steps: select a non-critical transformation, version the artifact, define a deterministic sampling rule and implement a shadow run with automated tests. If you’d like, we can help design the plan and thresholds based on your business KPIs — which transformation in your pipeline would you consider suitable for a first canary?