
Few metrics capture the promise of a logistics operation as well as OTIF — short for On Time In Full, the percentage of orders delivered to the customer both on time and complete. It is simple to state and brutally honest: either the order arrived on the agreed date with everything that was requested, or it does not count.
That strictness is exactly what makes the metric valuable. A delivery that arrives on the right day but with half the units fails. One that brings everything, but three days late, also fails. OTIF looks at the customer experience the way the customer actually lives it — not through averages that hide the problems — which is why it has become one of the metrics most used by retailers, distributors, and manufacturers to assess a supplier's service.
In this article we look at what OTIF really measures, why it is mathematically harder than it seems, how to calculate it rigorously, and what data you need to track it without fooling yourself.
What OTIF is and why it is such a demanding metric
OTIF combines two conditions into one. The On Time part asks whether the order was delivered within the agreed lead time; the In Full part asks whether it was delivered in its entirety, with no missing items or quantities. An order only counts as OTIF if it meets both at once. There is no partial credit.
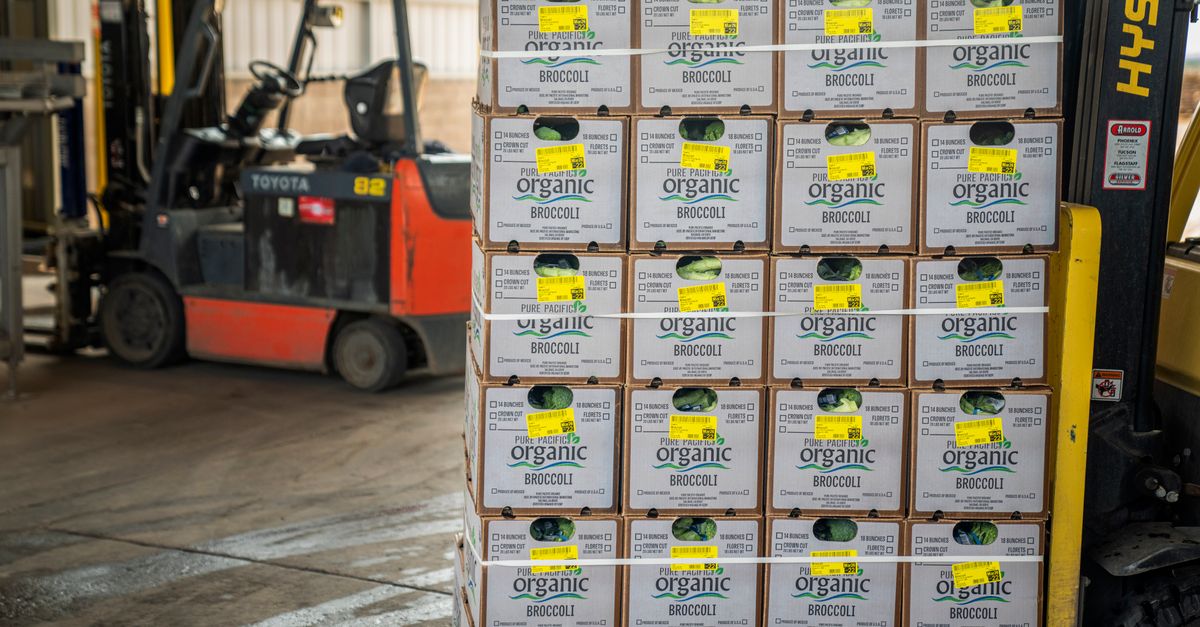
It is this "all or nothing" rule at the order level that sets OTIF apart from more forgiving metrics. Many operations report 95% on-time deliveries and feel comfortable, without realising that once you combine that figure with the rate of complete orders, the service actually perceived by the customer can be well below it. OTIF forces that honesty.
The maths of OTIF: why 92% and 94% do not give 92%
The most common mistake is to treat the two components as independent and settle for the better of them. If 92% of orders arrive on time and 94% arrive complete, the temptation is to say service is running at around 92%. But OTIF only counts orders that get both dimensions right at the same time, and so it is always less than or equal to the worse of the two components.
The formula is straightforward:
OTIF = orders on time and complete / total orders
When lead-time failures and quantity failures occur in different orders, OTIF approaches the product of the two rates — in the example above, roughly 0.92 × 0.94 ≈ 86%. In practice, failures tend to be correlated (a stockout both delays an order and leaves it incomplete), which softens the effect somewhat, but the lesson holds: combining conditions never improves the result, it can only make it worse. That is why an OTIF of 95% represents a genuinely well-tuned operation.
Defining "on time": which date counts?
Before measuring anything, you have to agree on what "on time" means. Is the date requested by the customer the same as the date confirmed by the company? Does the dispatch date count, or the actual delivery date? Is there a tolerance window — say, the agreed day plus or minus one — or is the exact day required?
These choices are not details: they move the metric by several percentage points. What matters is defining the rule explicitly, aligning it with what the customer values, and keeping it stable over time, so that changes in OTIF actually mean something. Measuring against the confirmed date is more generous; measuring against the date originally requested is closer to the customer's real expectation.
Defining "in full": by line, by unit, or by order
The In Full component also allows several readings. It can be measured as the percentage of order lines served in full, the percentage of units delivered against those requested, or the percentage of 100% complete orders. Each choice answers a different question and produces different numbers.
For OTIF purposes, the most coherent approach is to assess "in full" at the order level: it is complete if every line was fully satisfied. This keeps the metric faithful to the "all or nothing" logic. To diagnose where the problem lies, however, measuring the fill rate by line or by unit is far more informative, as we will see next.
OTIF, fill rate, and on-time: how they differ and when to use each
These three metrics answer complementary questions, and it pays not to confuse them:
- On-time: what percentage of orders (or lines) arrived within the lead time. Isolates lead-time performance.
- Fill rate: what percentage of the units or lines requested was actually served. Isolates the ability to meet demand from stock.
- OTIF: what percentage of orders met both lead time and quantity at once. Summarises the customer experience in a single measure.
In day-to-day management, OTIF is the headline metric reported to management and customers; on-time and fill rate are the diagnostic lenses that explain why OTIF rose or fell. Reporting OTIF alone without its components is like having a fever without knowing where it hurts.
From OTIF to the "perfect order": adding quality and documentation
Some organisations go further and measure the perfect order: an order that is on time, complete, undamaged, and with correct documentation (the right invoice, error-free shipping notes, compliant labelling). It is OTIF plus the quality and administrative dimensions that also determine whether the customer is satisfied.
Because it stacks even more conditions, the perfect order is always equal to or lower than OTIF, and it tends to reveal problems invisible to flow metrics — returns for damage, invoicing disputes, payment delays caused by wrong documents. It is worth adopting once OTIF is already mature and you are reaching for the next level of service.
What data you need — and where it usually lives
A reliable OTIF requires, for each order, a handful of fields: requested date, promised date, actual delivery date, quantities ordered and quantities delivered per line, and a record of damage or returns. This data is rarely in a single place: the dates and requested quantities come from the ERP, warehouse movements from the WMS, and deliveries from the TMS or proof-of-delivery records.
The metric's greatest enemy is not the formula, it is data quality. Delivery dates filled in by copying the promised date, quantities updated late, or unrecorded returns produce an optimistic OTIF that no one can use to decide. Before setting targets, it is worth auditing the source of each field and ensuring the delivery date is captured at the actual moment of delivery.
Setting targets: why 100% almost never pays off
It is tempting to demand 100% OTIF, but perfection has a cost that grows steeply. Ensuring that no order ever fails means high safety stock, redundant transport capacity, and slack everywhere — tied-up money that often exceeds the value of the failures it avoids. The right target balances the cost of serving against the cost of failing.
That balance depends on context. In food retail, many customers impose contractual penalties (chargebacks) for OTIF failures, which pushes the target to high values, typically above 97%. In other sectors, an OTIF of 92% to 95% can be perfectly healthy. The key is to set the target by looking at what customers penalise and at the marginal cost of each additional point, rather than copying a number from another industry.
Mini-case: a distributor recovering its service level
A food distributor tracked on-time deliveries (94%) and felt comfortable — until a large customer presented OTIF figures of just 87% and threatened penalties. Breaking the metric down, the team discovered that most failures were not about lead time but about quantity: stockouts on high-rotation items left orders incomplete, and a few picking errors made things worse.
The actions were focused. They reinforced safety stock only on class A items, introduced barcode verification in picking to eliminate mix-ups, and agreed more realistic delivery windows with the carrier. Two quarters later, OTIF had risen to 95%, chargebacks fell to near zero and — perhaps most importantly — the relationship with the customer moved from conflict to partnership. The gain did not come from working harder, but from measuring the right thing and acting on the real cause.
In practice
OTIF is a mirror: it shows service as the customer feels it, without the averages that usually mask the problems. To use it well, measure it at the order level, define "on time" and "in full" explicitly and stably, and always track it alongside on-time and fill rate, which tell you where to act. Set a target that makes sense for your business's cost structure, treat data quality as a prerequisite, and once the metric stabilises, evolve towards the perfect order. Measured well, OTIF stops being a number in a report and becomes an honest conversation about the promise the operation makes — and keeps — every day.
