“A data catalog is not a document library; it is an operational bridge between those who produce data and those who use it to make decisions.”
Why a pragmatic data catalog matters for data teams
Many organizations invest time and money in cataloging solutions that end up being little used. The reason is not lack of technology, but lack of operational focus. A useful catalog is one that reduces discovery time, prevents rework and improves trust in data — not one that has 100% of the metadata filled out but is forgotten in a corner of the intranet.

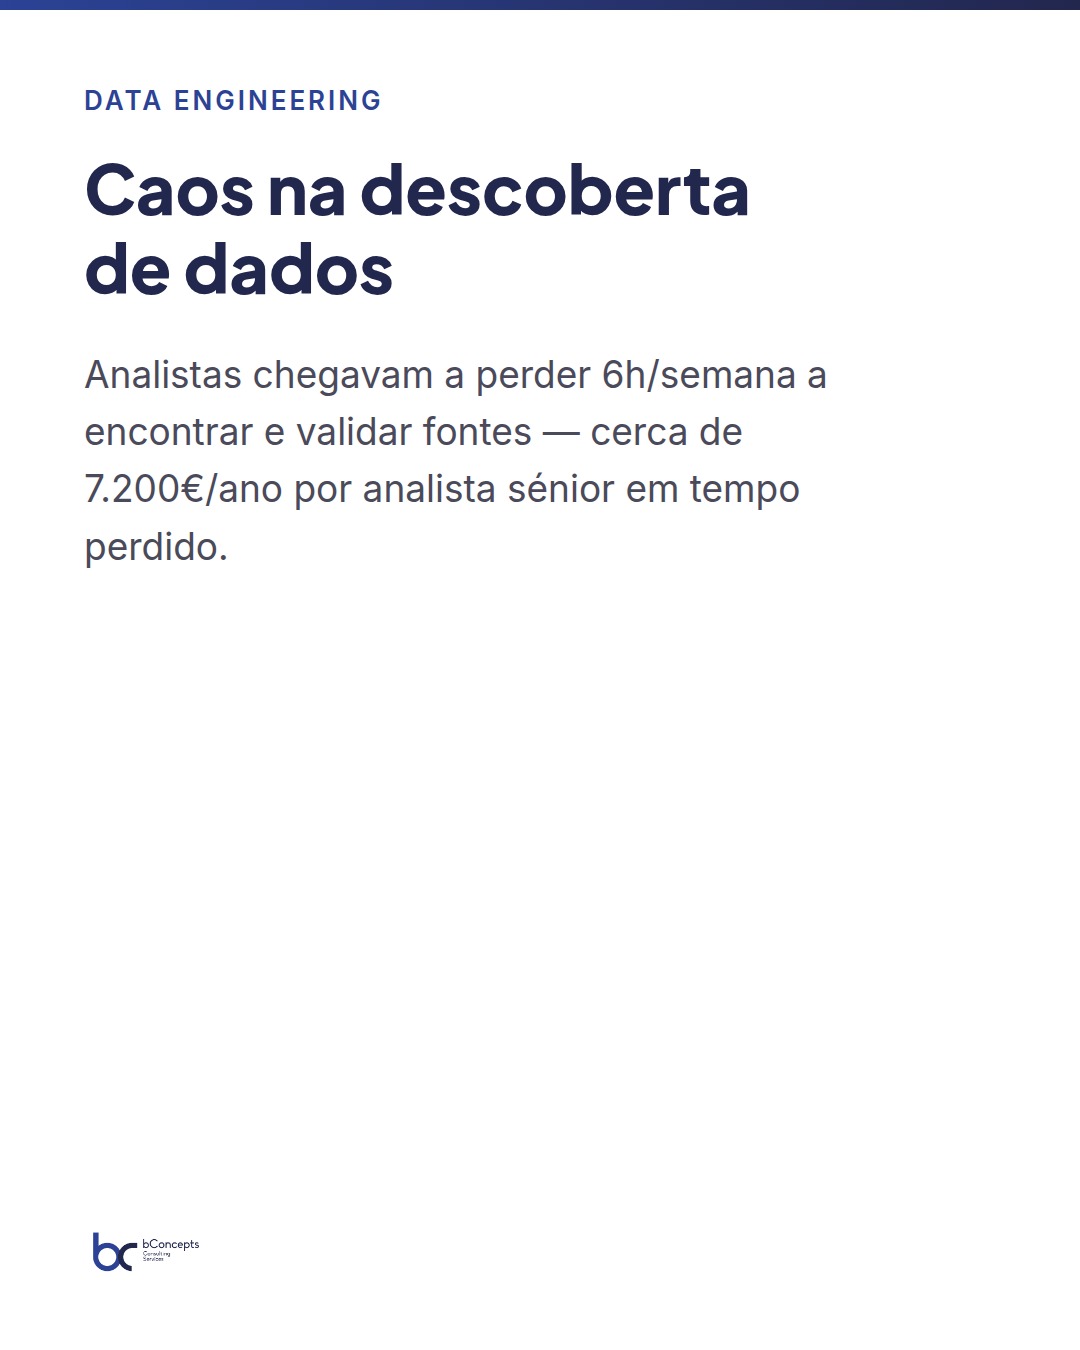
On the ground, we see recurring scenarios: critical reports depend on undocumented intermediate views, an analyst uses an obsolete table and the distribution of results differs 12% from the reported value, or an audit requires lineage that takes days to reconstruct. These failures cost time and money: a senior analyst who loses 4 hours per week searching for sources represents about €7,200 annually (assuming €45/h and 40 working weeks). A well‑designed catalog reduces that waste.
In practice, our work at bConcepts shows that real gains appear when the catalog is integrated into the team’s workflows: data architects, engineers, analysts and product owners. If perceived as a bureaucratic obligation, it will be ignored. If perceived as a tool that solves concrete problems — finding the right version of a table, knowing who to contact, viewing lineage for audits — then it becomes used daily. Adoption turns it from a passive repository into an active work instrument.
Set clear objectives: what to measure from day one
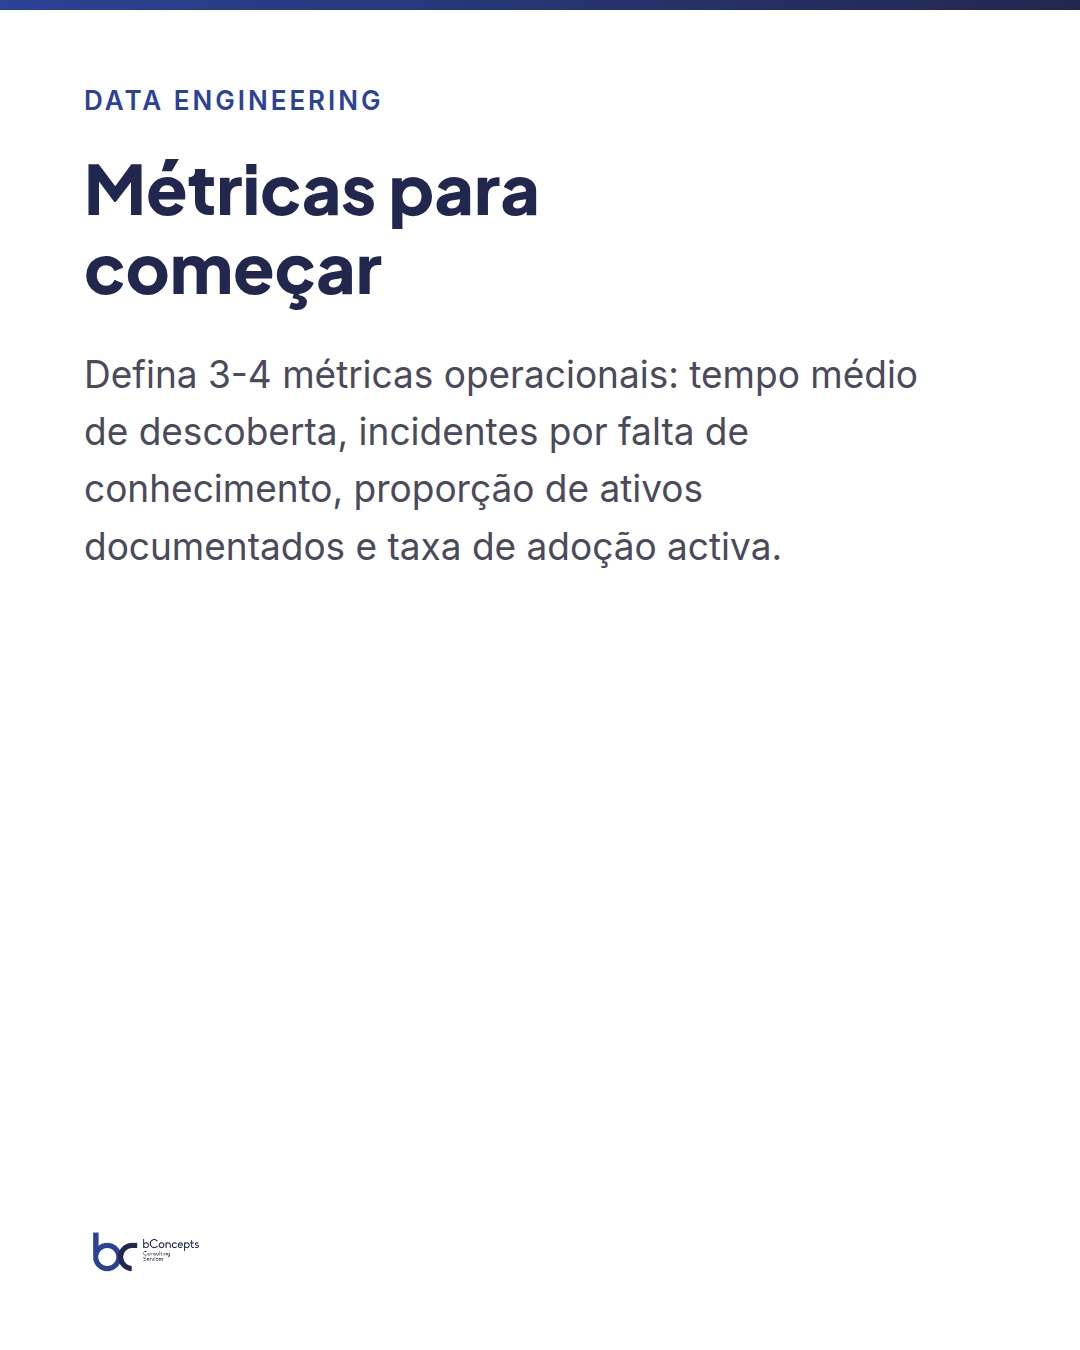
Before choosing tools or modeling the taxonomy, determine 3–4 metrics that indicate operational success. Practical, measurable suggestions:
- Average asset discovery time: measure how long it takes a user to find and validate an asset before catalog implementation. Typical target: reduce by 50% in 6 months. For example, from 6h/week to 3h/week per analyst.
- Number of incidents due to lack of data knowledge: record incidents related to using wrong sources, lack of owner or lineage doubts. Target: reduce 30% in 12 months.
- Proportion of assets with owner, description and documented schema: set a pragmatic initial target, e.g. 70% in 6 months for critical assets.
- Active adoption rate: percentage of users who consult the catalog at least once a week. Initial target: 30–40% among data users in a pilot phase.
These metrics allow cutting superfluous features and prioritizing integrations that bring immediate value. For example, integrating the catalog with the ticketing system (Jira, ServiceNow) and with Slack/Microsoft Teams allows associating access requests to specific assets and collecting continuous feedback. If each resolved ticket is associated with a documented asset, you can quantify the direct impact on resolution time.
Choose the right grain: integration with pipelines and quality controls
A catalog populated only manually rarely stays up to date. The pragmatic approach combines automatic metadata ingestion with human curation. Start by identifying the main sources of truth and ensuring connectors for those platforms: data lake (Delta), SQL databases (Postgres, SQL Server, Snowflake), processing environments (Databricks, Synapse) and reporting/BI (Power BI, Tableau).
Automatic ingestion should capture schemas, data samples, lineage, statistics and technical metadata (last load, table size). Automation does not eliminate curation; rather it reduces repetitive effort and allows curators to focus on semantic quality. We recommend a daily ingestion cadence for critical assets and weekly for the rest.
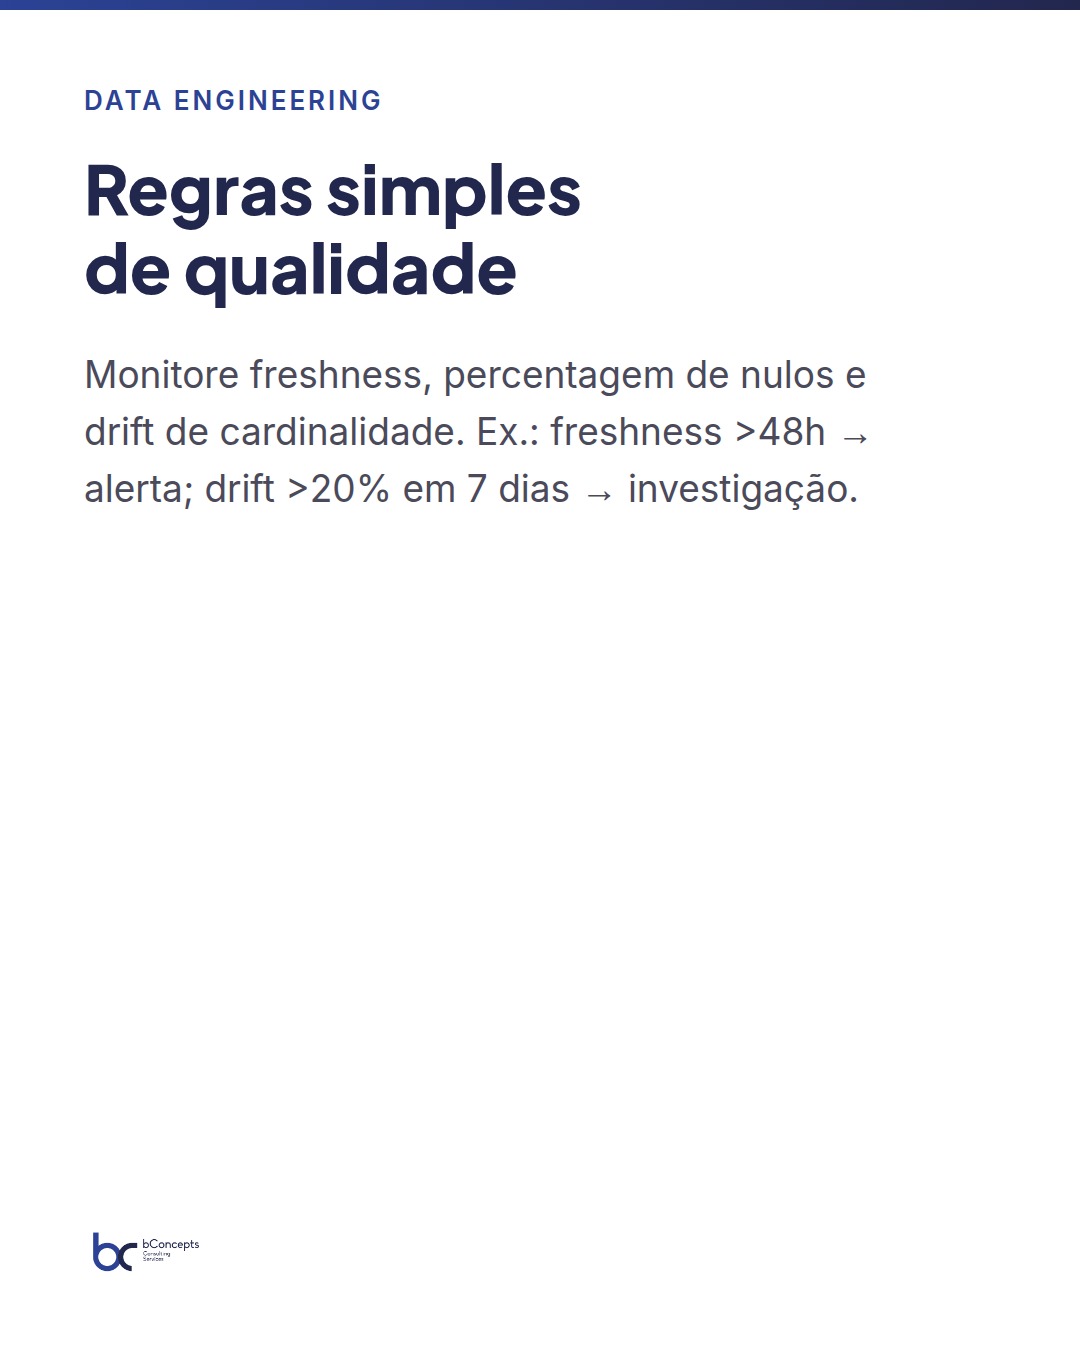
Overlaying simple quality rules makes the catalog valuable: freshness indicators (last load), percentage of nulls per column, cardinality and distribution of outliers. For example, an asset with >30% nulls in a key column can be flagged with an alert. Define practical thresholds: freshness >48 hours → alert; cardinality drift >20% in 7 days → investigation. Integrate alerts with notification channels so the team receives signals before issues affect production reports.
Taxonomies and business glossary: pragmatism over perfection
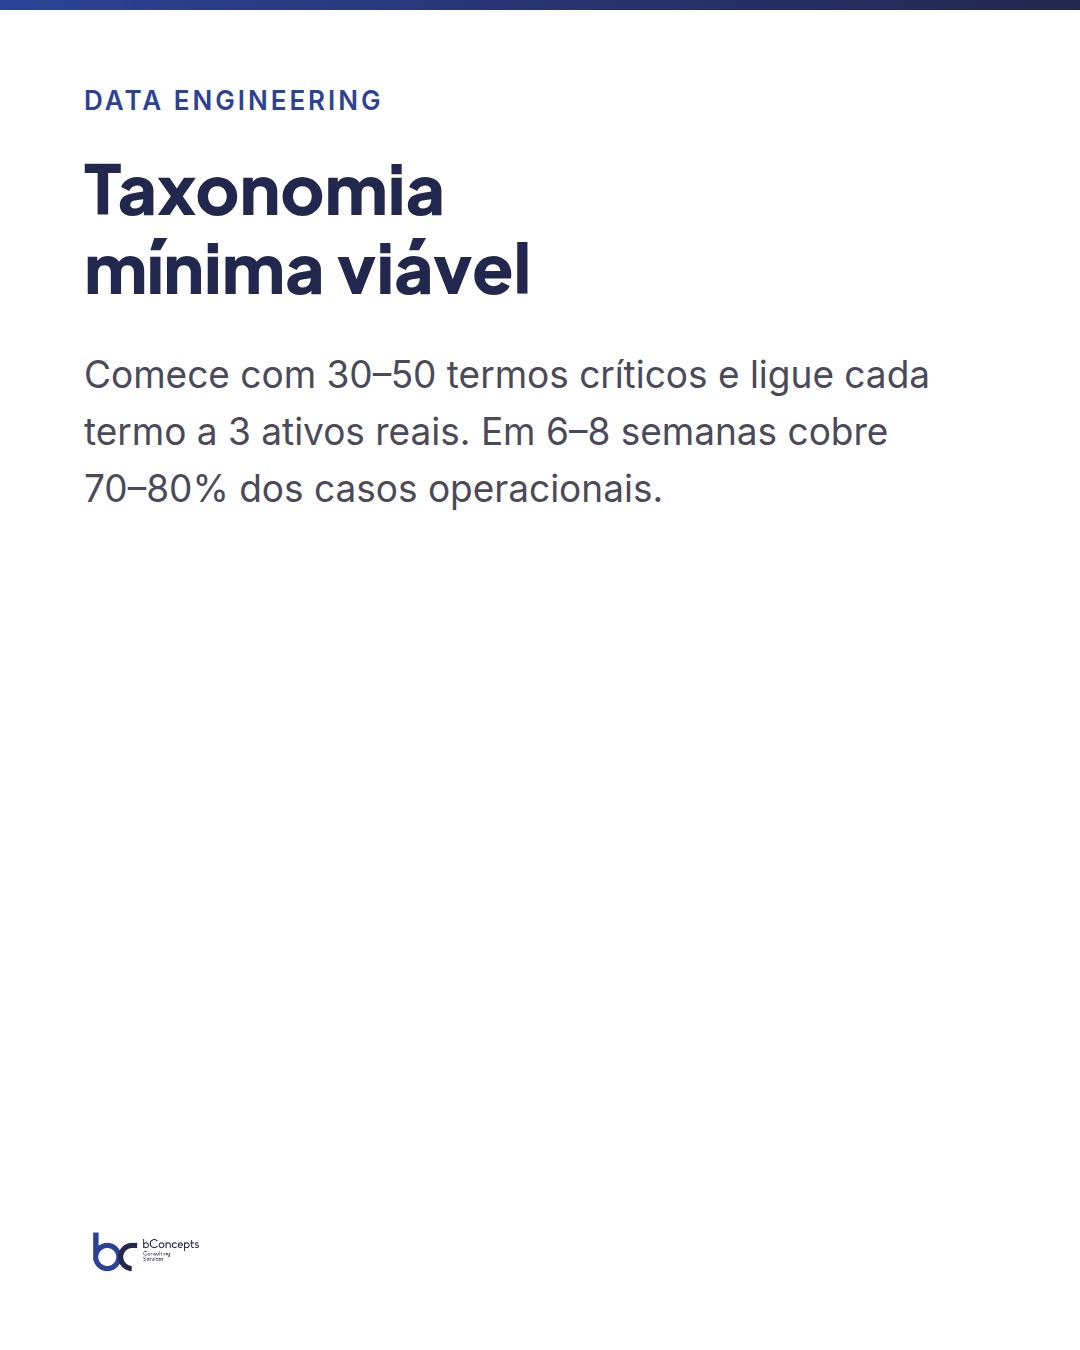
The most common mistake is trying to define a perfect glossary before starting. Instead, implement a minimal viable taxonomy (MVT): a limited set of categories that answers the most frequent business questions. Suggested initial MVT: business topics (finance, sales, operations, logistics), asset types (table, view, Power BI dataset, pipeline), sensitivity domain (public, internal, restricted) and criticality classification (critical, important, supporting).
This taxonomy should be extensible and governed by a small cross‑functional group (6–8 people) with representatives from business, engineering and security. Adopt a lightweight process to validate terms: biweekly 30‑minute meetings for 6–8 weeks to resolve disagreements and update the glossary. Typically, the team stabilizes the 30–50 critical terms in that period, enough to cover 70–80% of operational use cases.
Validate terms with concrete examples: link each glossary term to 3 real assets (a table, a report and a metric), and use those examples as test cases. This accelerates understanding and enforces consistency without requiring extensive documents.
Interface and adoption: make the catalog part of the workflow
The catalog interface should be where users already work. Integrate the catalog into existing tools: descriptions and lineage in Power BI next to reports, extensions for VS Code or plugins for notebooks in Databricks, and contextual links in pipelines (Azure Data Factory, Synapse). Integration reduces friction: when an engineer opens a pipeline, they should be able to access the asset in the catalog in two clicks.
Contextual notifications are powerful. For example, when opening a Power BI report that uses a dataset with freshness >72 hours, show a warning and a link to the source. These micro‑interventions educate and encourage metadata updates without formal processes.
Practical training in small sprints is more effective than long courses. 45‑minute sessions focused on “how to find table X”, “how to check the location of a sensitive column” or “how to open a ticket associated with an asset” are sufficient to gain traction. Complement with micro‑content (5‑minute videos, cheat sheets) and public usage metrics (dashboard with top users, most searched assets) to create visibility and healthy competition. Simple rewards — recognition in team meetings and symbolic certificates — increase adoption and keep the culture active.
Mini practical case: catalog implemented in a medium company
In a retail company with 280 employees (60 in digital operations, 12 in the data team), the lack of cataloging caused delays: analysts spent an average of 6 hours per week locating and validating data. We implemented a pragmatic catalog in 3 months with the following steps:
- Phase 0 (2 weeks): inventory of 10 critical assets and measurement of initial discovery time.
- Phase 1 (4 weeks): integration with the data lake (Delta), ingestion of metadata from 120 tables and 45 Power BI datasets, creation of the minimal glossary of 40 terms and definition of owners for 80% of critical assets.
- Phase 2 (4 weeks): quality rules, freshness alerts configured (24/48/72h), integration with Jira and Microsoft Teams, and 45‑minute training sprints for analysts and engineers.
Results after 6 months:
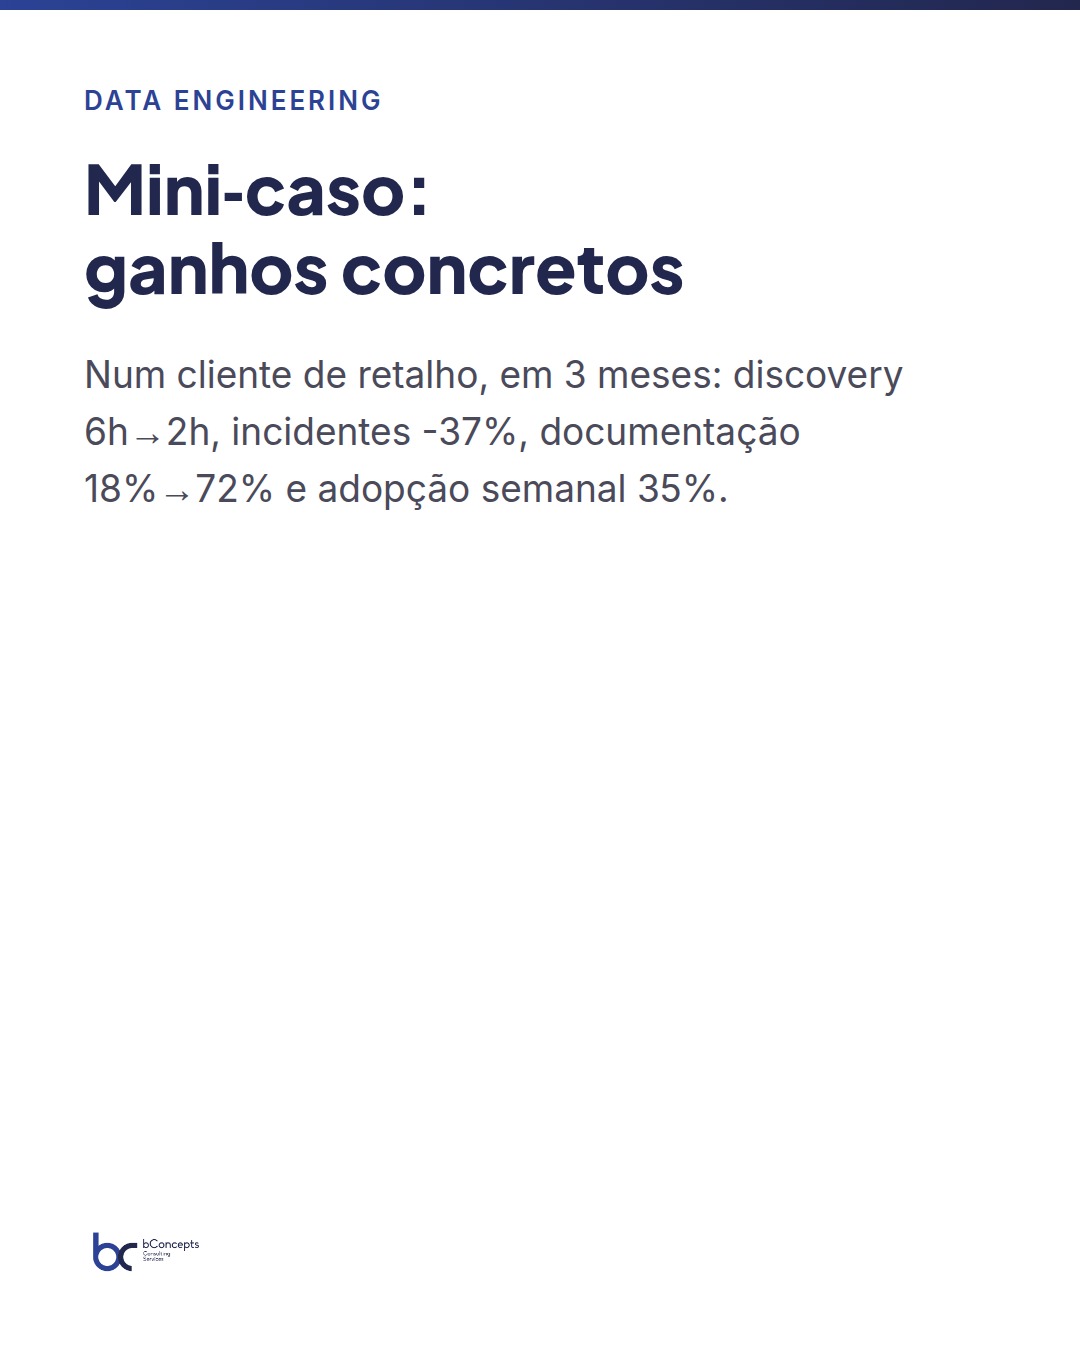
- Average discovery time reduced from 6h to 2h per analyst/week (estimated saving of 48 hours/month — equivalent to ~1.2 FTE).
- Incidents related to data discrepancies fell 37% (from 30 to 19 per quarter).
- Proportion of assets with owner and documentation increased from 18% to 72%.
- Adoption rate: 35% of data users consulted the catalog weekly after 3 months.
Financially, with an average cost of €45/h per analyst, the time reduction translated into an approximate direct saving of €2,160/month — not counting the value of faster decisions on marketing campaigns that allowed, for example, adjusting promotions and recovering 0.8% of monthly churn. The return on investment was visible in less than eight months when including operational gains and reduced incidents.
A truly useful catalog is measured by the time it saves users, not by the number of fields documented.
Lightweight governance: actionable policies and clear responsibilities
Governance does not mean bureaucracy. Define concrete responsibilities: owners for each asset (technical owner and business sponsor), curators by domain and a monthly committee to resolve conflicts and priorities. Simple models work better: for example, “every dataset published in Power BI must have an owner, minimal description and a freshness measure before publication”.
Automate checks: rules that block publication if an owner is missing, automatic ticket creation when freshness exceeds 48 hours, and automatic messages to owners when quality statistics exceed thresholds. These automations keep governance lightweight but effective, reducing dependence on constant manual reviews.
Define clear operational SLAs: response times to incidents (for example, acknowledgment within 4 hours for critical assets), cadence of metadata reviews (quarterly for important assets) and public compliance metrics for the policy. Transparency creates accountability and encourages regular maintenance.
Integration with observability and data quality
A catalog linked to observability pipelines becomes a proactive tool. Associate quality alerts (e.g.: schema break, cardinality drift, sudden increase in nulls) to assets in the catalog. When a user consults a table, they should see not only the schema and owner, but also the last 30 days of quality signals, drift charts and open incidents.
This reduces investigation costs when something goes wrong. In our implementations, the average incident resolution time involving lineage decreased 25% because teams could locate dependencies and owners more quickly. Concretely, an average incident that used to take 16 hours to resolve went to 12 hours — a saving of 4 hours per incident, multiplied by dozens of incidents per quarter.
Additionally, by linking the catalog to CI/CD pipelines, it is possible to block deployments when changes affect critical assets without impact documentation; this prevents regressions and protects business KPIs.
In summary
- Set clear operational goals (discovery time, incidents, percentage of documented assets) and measure from the start.
- Combine automatic metadata ingestion with human curation to keep the catalog up to date and reliable.
- Start with a minimal viable taxonomy and evolve it with regular business validation.
- Integrate the catalog into workflows (Power BI, IDEs, pipelines) to increase adoption.
- Connect the catalog to observability and quality rules so it is a proactive tool, not just descriptive.
Conclusion: practical next steps
If you are considering a catalog, don’t start with technology: start with problems. Map 10 critical assets, identify owners and measure current discovery time. Then implement automatic ingestion for those 10 assets, add freshness and a simple publication rule. Measure the impact in 3 months and iterate.
At bConcepts we help teams design and execute this plan in 4–12 week phases, focusing on measurable results. A typical plan includes: initial inventory (2 weeks), technical integration and ingestion (4–6 weeks), adoption and governance sprints (4 weeks). How much is it worth for your organization to reduce 50% of the time analysts spend searching for data? Answer that question with numbers and you will have the justification to start today. What is the critical asset in your organization that, if cataloged correctly, would bring the largest time savings or risk reduction?